VoteAmerica 2020 campus mobilization program

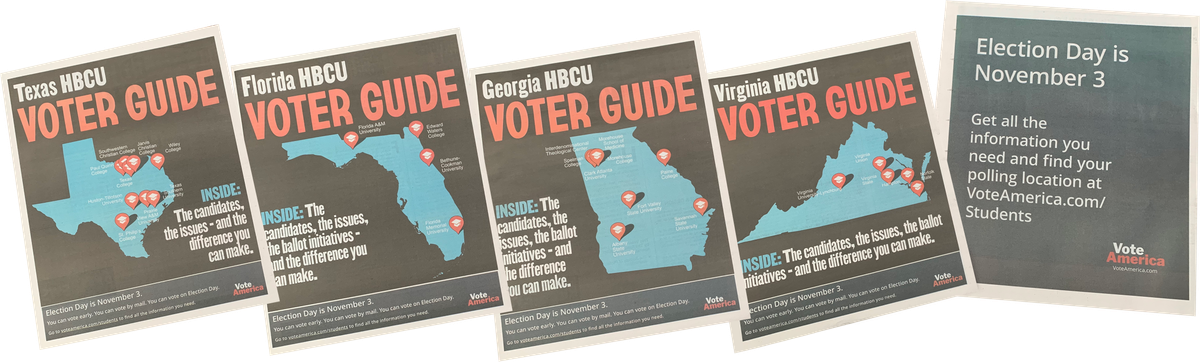
Debra Cleaver (VoteAmerica) has been working with Flytedesk since 2018 to run college mobilization programs that utilize campus-media to increase registration and turnout. "Campus media" includes all media that is placed on campus properties, whether physical or digital. Campus media includes physical and digital ads on campus; campus billboards, transit ads and large-format posters; physical inventory such as coasters; and other such media that is owned and distributed by the campuses and students. In 2020, we added a large-scale "influencer" program using college students who are popular on Tiktok with their peers. In 2020, Flytedesk hired Pantheon Analytics to student student reactions to the elections and to the GOTV ads they were seeing.
Overview
In the weeks just before and just after the 2020 election, Flytedesk administered a survey to students at college campuses across the US. Some of these campuses had been targeted by Flytedesk with election-related ads, and some were untreated campuses. The survey asked students about various aspects of their experience during the 2020 election cycle, including ad recall and voting behavior. Flytedesk recorded 2314 responses across 39 college campuses and 13 states.
We find that most students surveyed were registered voters who were highly motivated to participate in the 2020 election, but not very excited about either of the presidential candidates. We also found that students at schools where Flytedesk spent money had higher rates of ad-recall, voting knowledge, and election motivation.
Survey Results
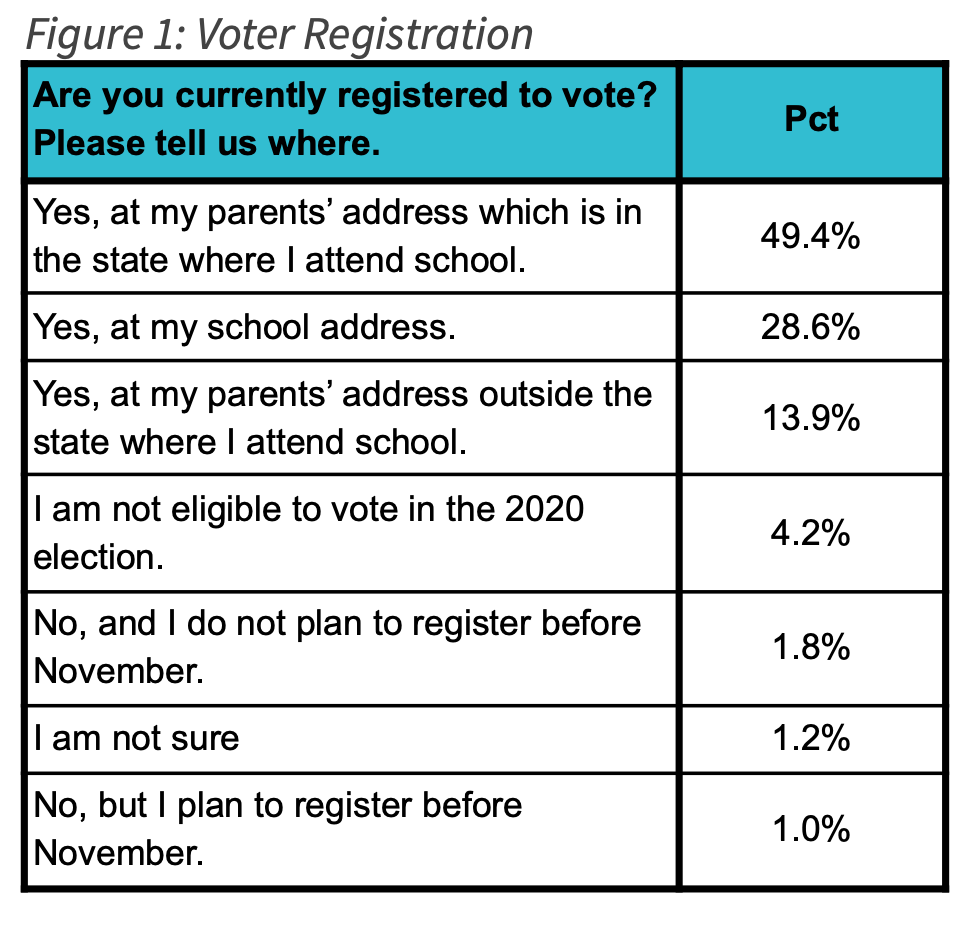
Figure 1 shows the self reported voter registration status of the entire survey sample. We can see that the vast majority of students (~92%) were certain that they were registered to vote. This rate of registration is higher than in the general student population in the US, and likely reflects a mild response bias; students who are more likely to respond to surveys may also be more likely to register to vote. This response bias does not preclude the survey from providing useful information, however. Indeed, the remainder of the survey analysis should be understood as reflecting the sentiments and behaviors among registered students.
About 30% of the survey respondents were registered to vote at their school address. Over 60% of students were registered at their family home address, which for the majority of them was in the state where they attend school.
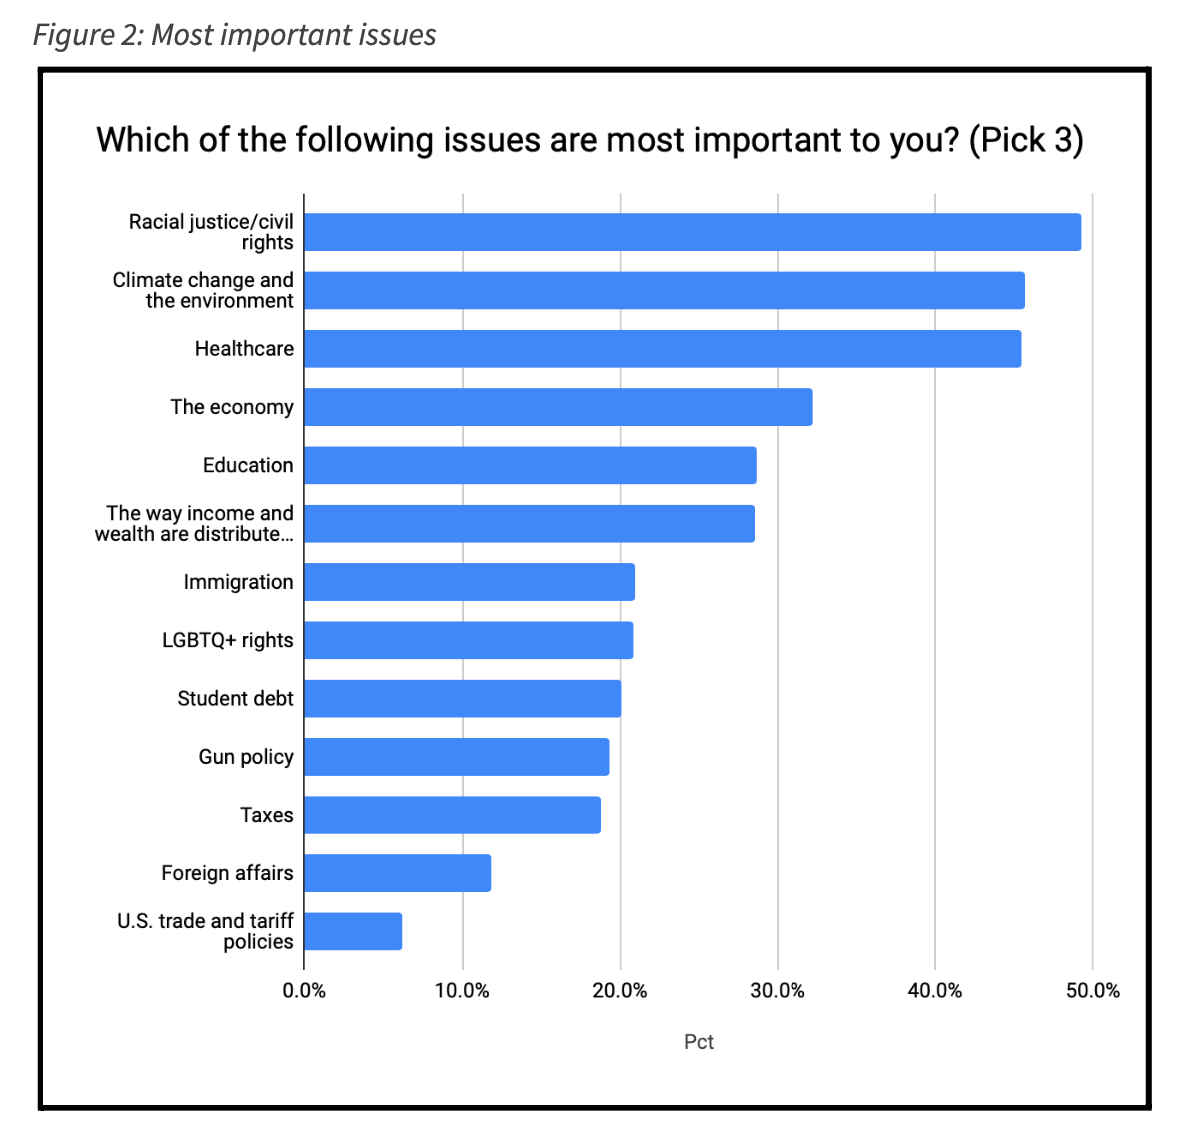
Students were asked to select their three most important issues from a list of 12. Figure 2 shows the percent of the sample that selected each issue in their top three most important issues. The top three most frequent issues were “Racial justice/civil rights”, “Climate change and the environment”, and “Healthcare”. The three least frequent issues were “Taxes”, “Foreign affairs”, and “U.S. trade and tariff policies”.
It is worth noting that some of the issues listed could apply to either side of an issue debate while others might not. For example, “Gun policy” could apply to students who are both for and against restrictions on gun purchases. Meanwhile, “Taxes” was listed as a separate issue from “The way income and wealth are distributed in the U.S.” This could have led students to bias one issue over another based on their political affiliation.
Students were asked how motivated they feel to vote in the 2020 election. Figure 3 shows the results. Over two thirds of students said they were “Extremely motivated.” Only 12% said they were “Neutral,” “Not voting,” or “Not motivated at all, but still voting.”
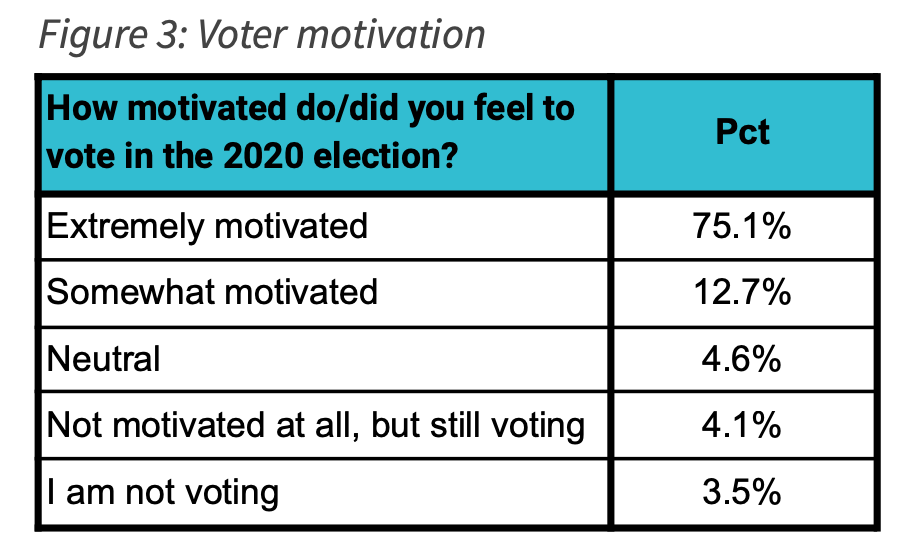
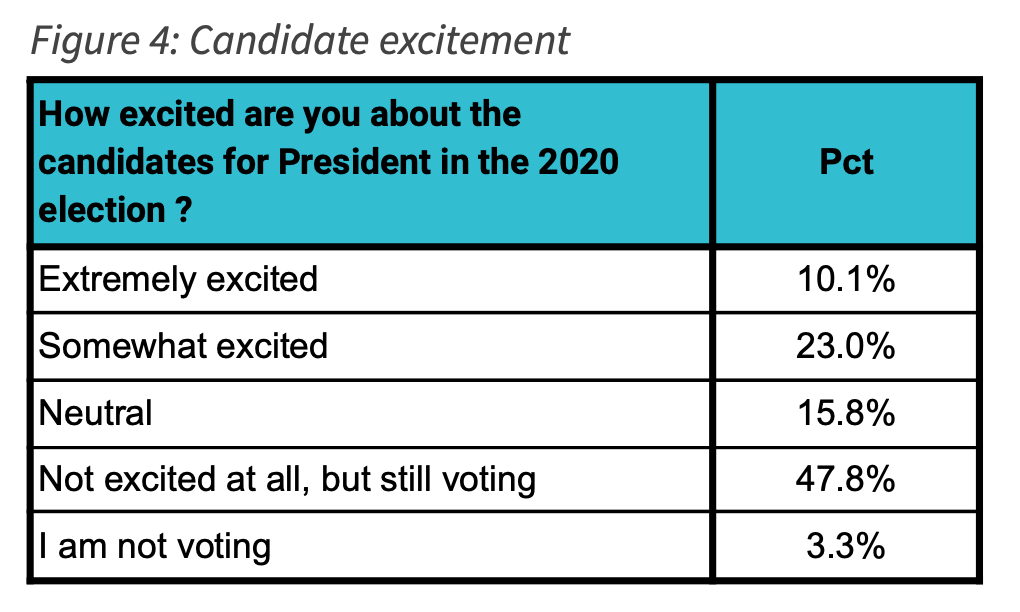
Figure 4 shows the results of students being asked if they were excited about the candidates for President in the 2020 election. Given the high levels of motivation, it is perhaps surprising that the vast majority of students were not particularly excited about 2020ʼs presidential candidates. In fact only 33% said that they were somewhat or extremely excited, and nearly half said that they were “Not excited at all, but still voting”.
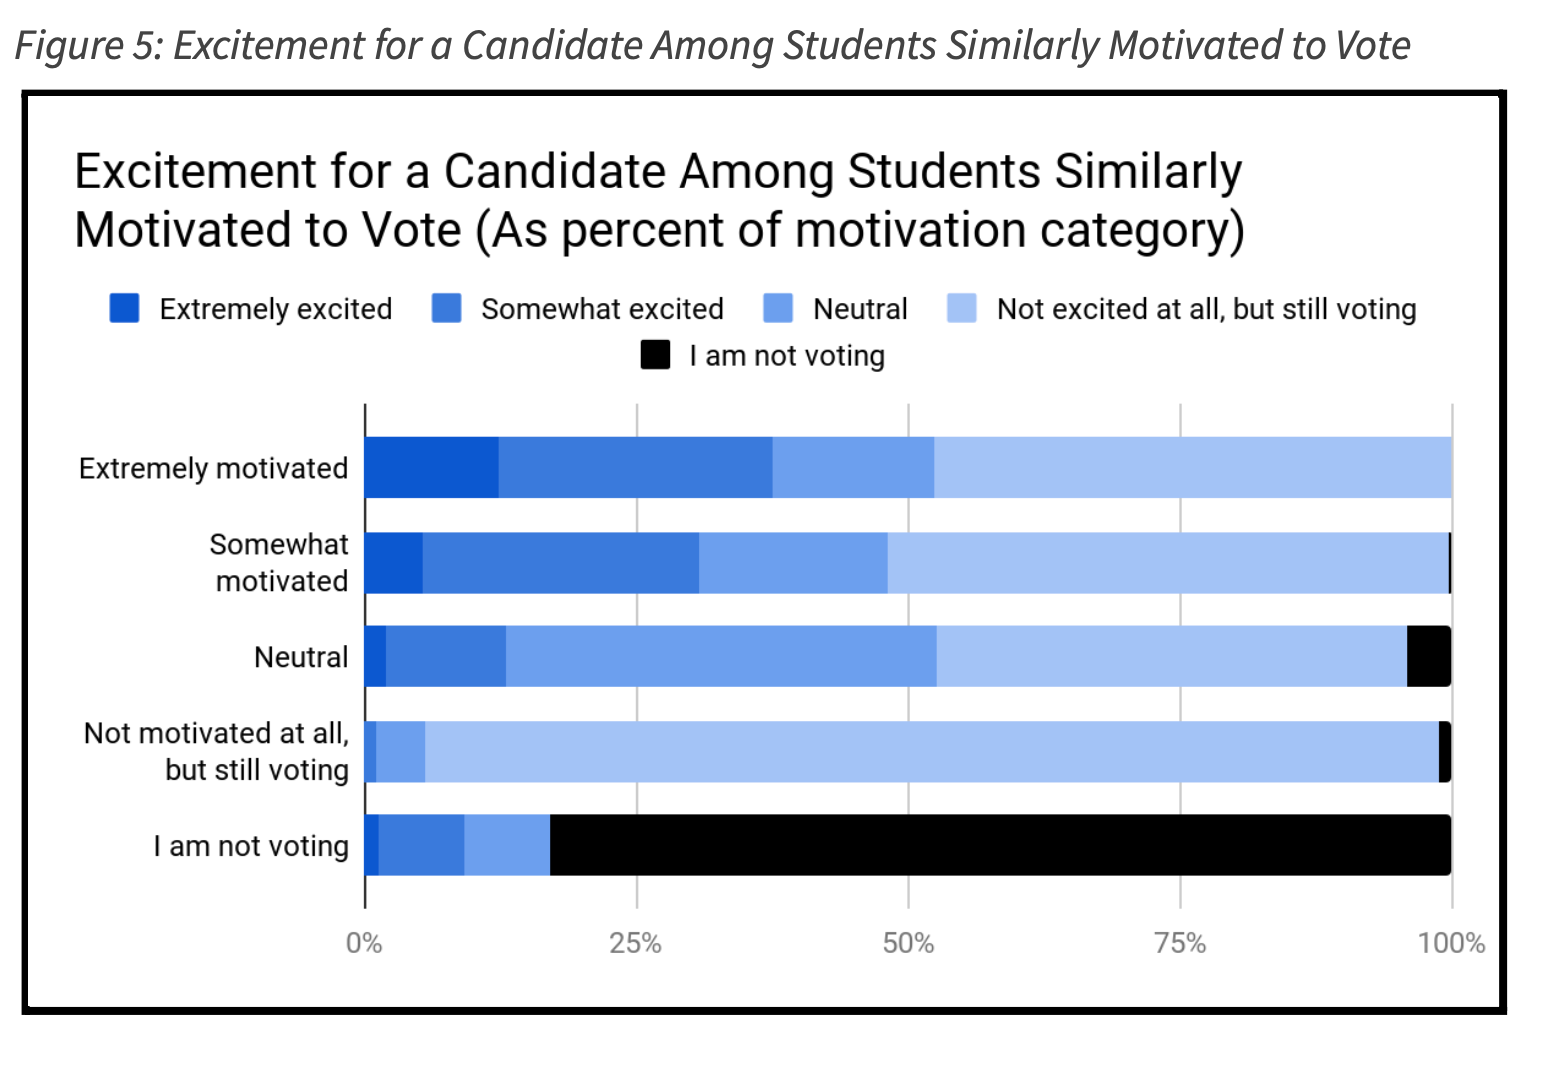
To explore this phenomenon we constructed Figure 5, which shows the proportion of people in each “motivation category” who chose a specific “excitement category”. In other words this shows how excited students were likely to be about any candidate given their motivation level.
Over 60% of the students who said they were extremely motivated or somewhat motivated to vote said that they were “neutral” about the candidates or “not excited at all, but still voting”. This would perhaps suggest that getting students excited about a candidate, while an effective motivator for some, is not a necessary part of motivating most students to vote.
Spend Analysis
The 2020 survey sample included students from schools where Flytedesk did and did not run election-related ads. This allows us to conduct some basic comparisons to see the effectiveness of Flytedeskʼs ad spending. However, it is important to note that the treated and untreated schools were not randomly assigned. Differences between the two groups – even those that would be considered statistically significant in an experimental setting – may reflect some degree of selection bias.
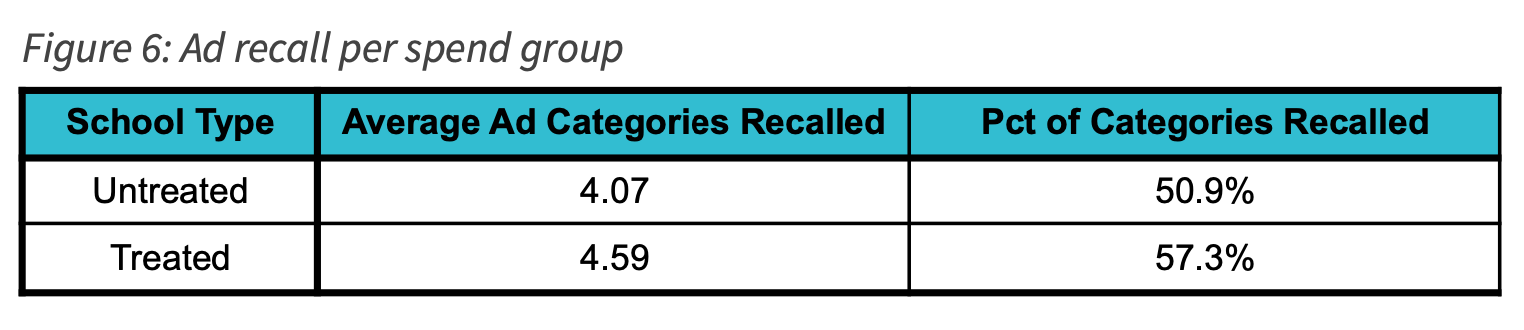
In the survey, students were asked if they recalled seeing election related ads in any of eight unique forms (campus signage, social media, etc). Figure 6 shows the ad recall rate for students in each treatment group.
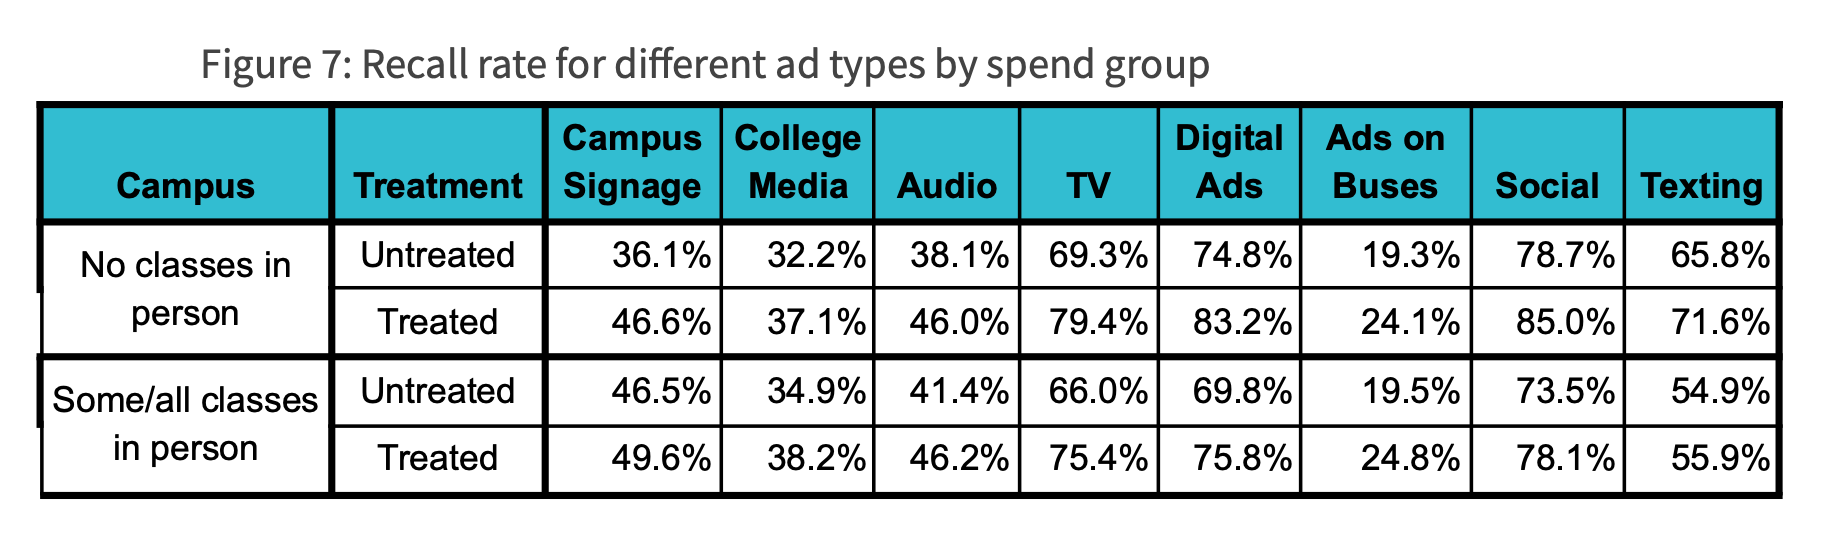
When we break down ad recall for each medium in Figure 7 we see that students at the treated schools generally recalled more ads than in the untreated schools. Further examination is needed to fully understand the nuances of ad recall in a pandemic-era campus environment. For instance, it certainly raises some questions around the accuracy of ad recall seeing that students with no in person classes still reported seeing campus signage. However, it is also possible that many students stayed on or near campus even when their classes were remote – making it plausible that some remote students did indeed see campus signage.
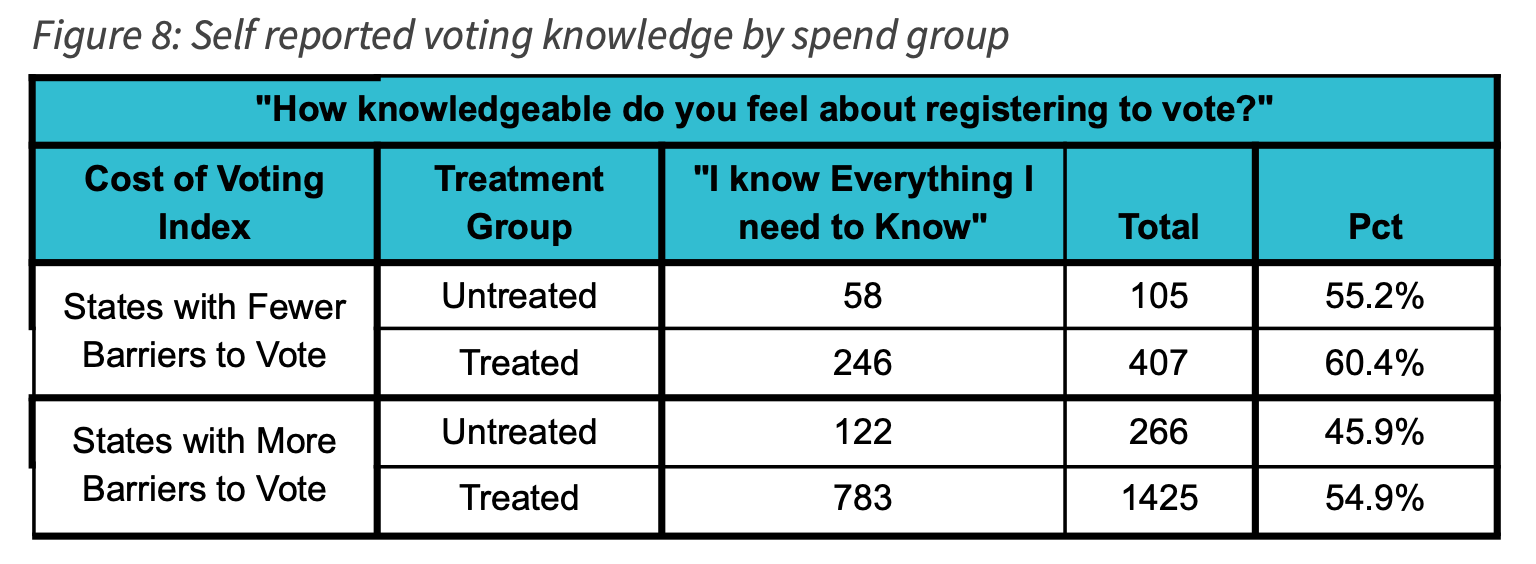
Students were asked about their knowledge with regards to registering to vote. Figure 8 shows the comparison of responses to the most confident option: “I know everything I need to know.” Students at the treated schools were more likely to feel confident that they had the knowledge to register. Moreover, this treatment effect was much more pronounced in the states with less voter-friendly laws. Students at treated schools in these states were nine percentage points more likely to feel they had sufficient knowledge.
When looking at the correlation between treated campuses and self-reported motivation to vote, we split students into four groups based on the spend/student for each school in the sample: a control group of $0/student, $0-6/student, $6-10/student, and above $10/student.
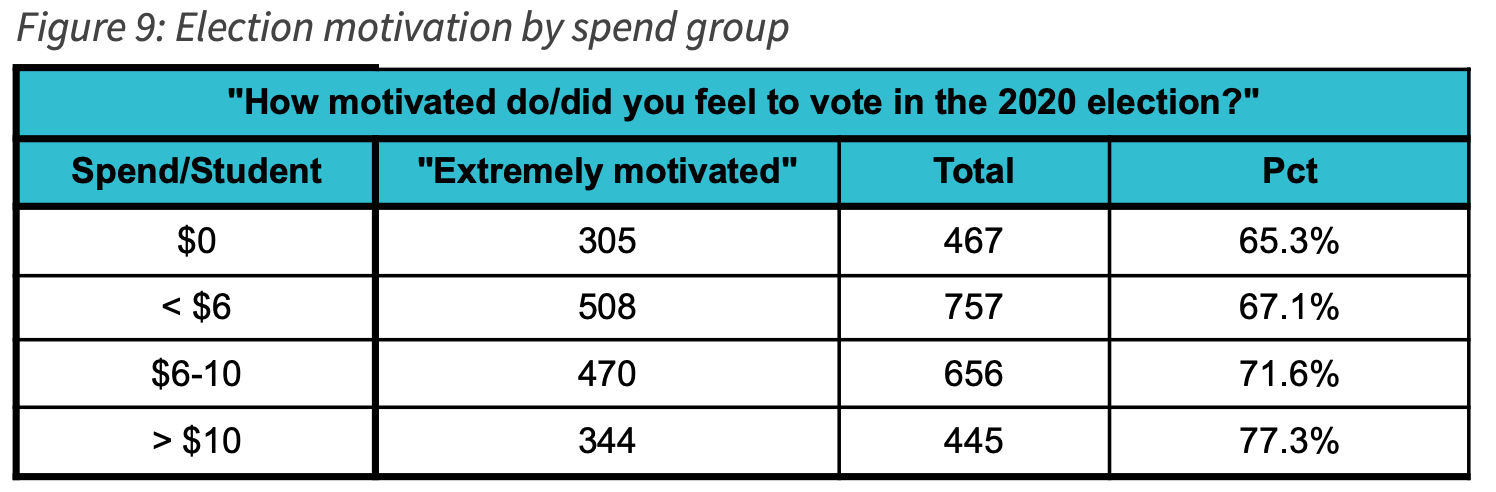
The survey asked students if they were motivated to vote in the 2020 election. Figure 9 compares the responses to the top option: “Extremely motivated”. It should be noted that while there are relatively similar amounts of students in each group, the number of schools in each group are not evenly distributed, nor are they randomly assigned. However, the monotonic correlation between spending and motivation is noteworthy. Higher ad spending correlated with greater motivation to vote.
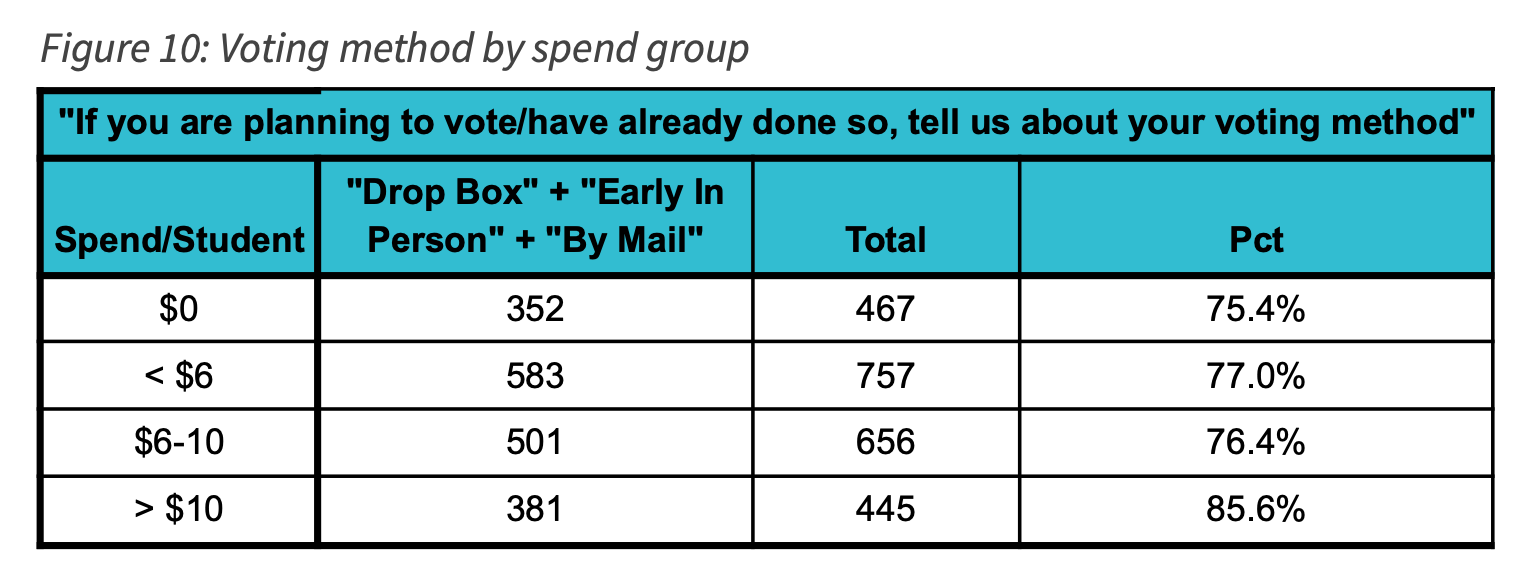
Students were asked for their intended method of voting in the 2020 election. Due to the differences in state election law, we chose to aggregate all responses that were not the “traditional” voting of in person on election day. Figure 10 shows the results by spend group. Once again, we see a correlation between ad spending and the proportion of students reporting pre-election day voting.
Influencer Analysis
Flytedesk and its partners ran many types of advertising and outreach campaigns on various campuses. One method was to work with on-campus influencers to promote messages about voter registration, voting information, and enthusiasm about the election.
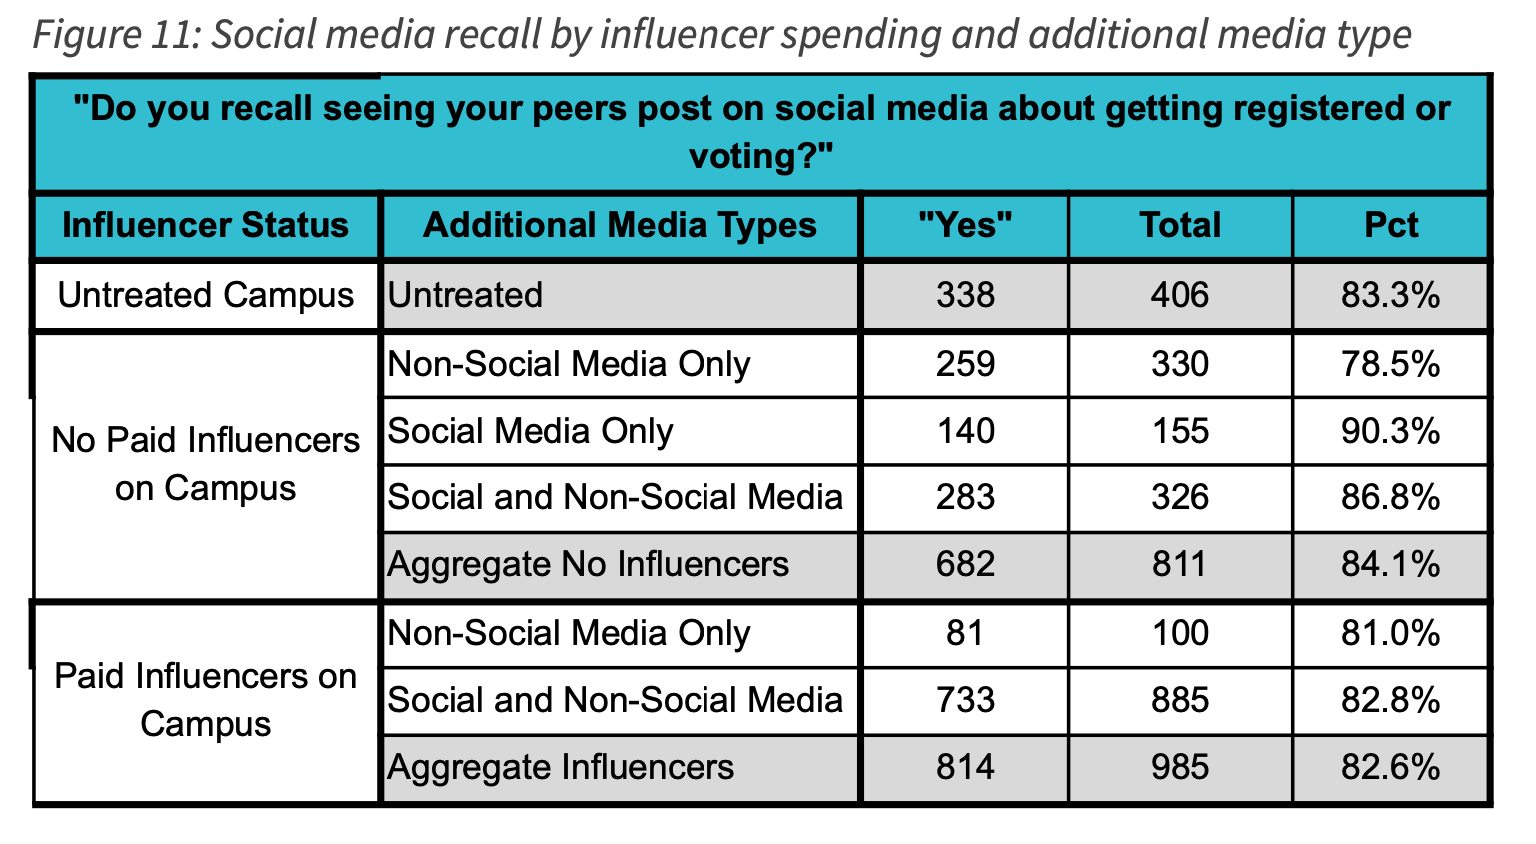
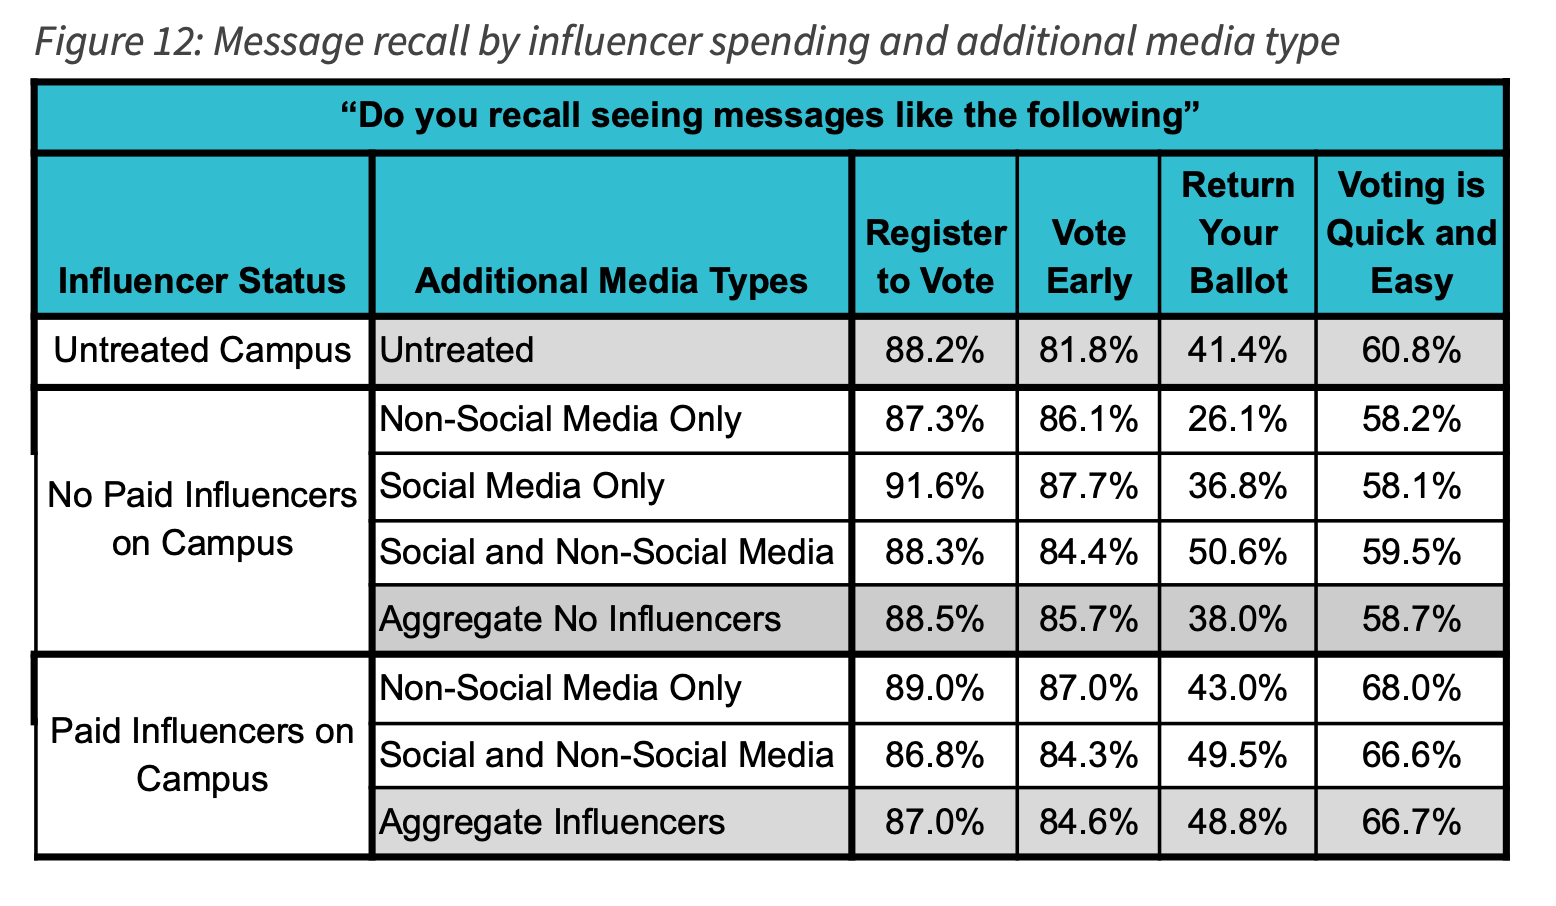
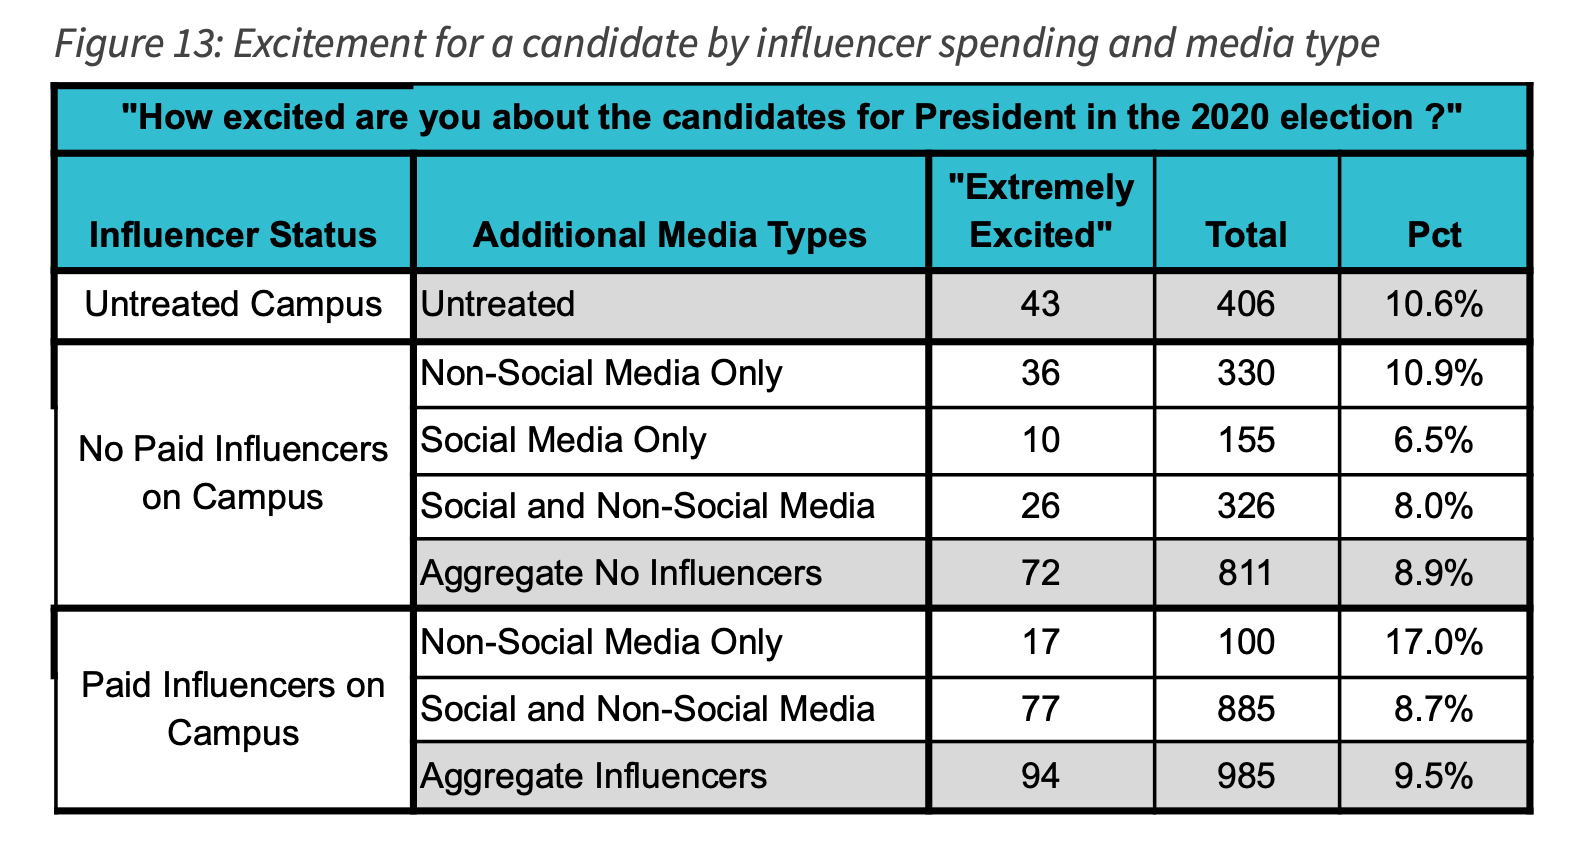
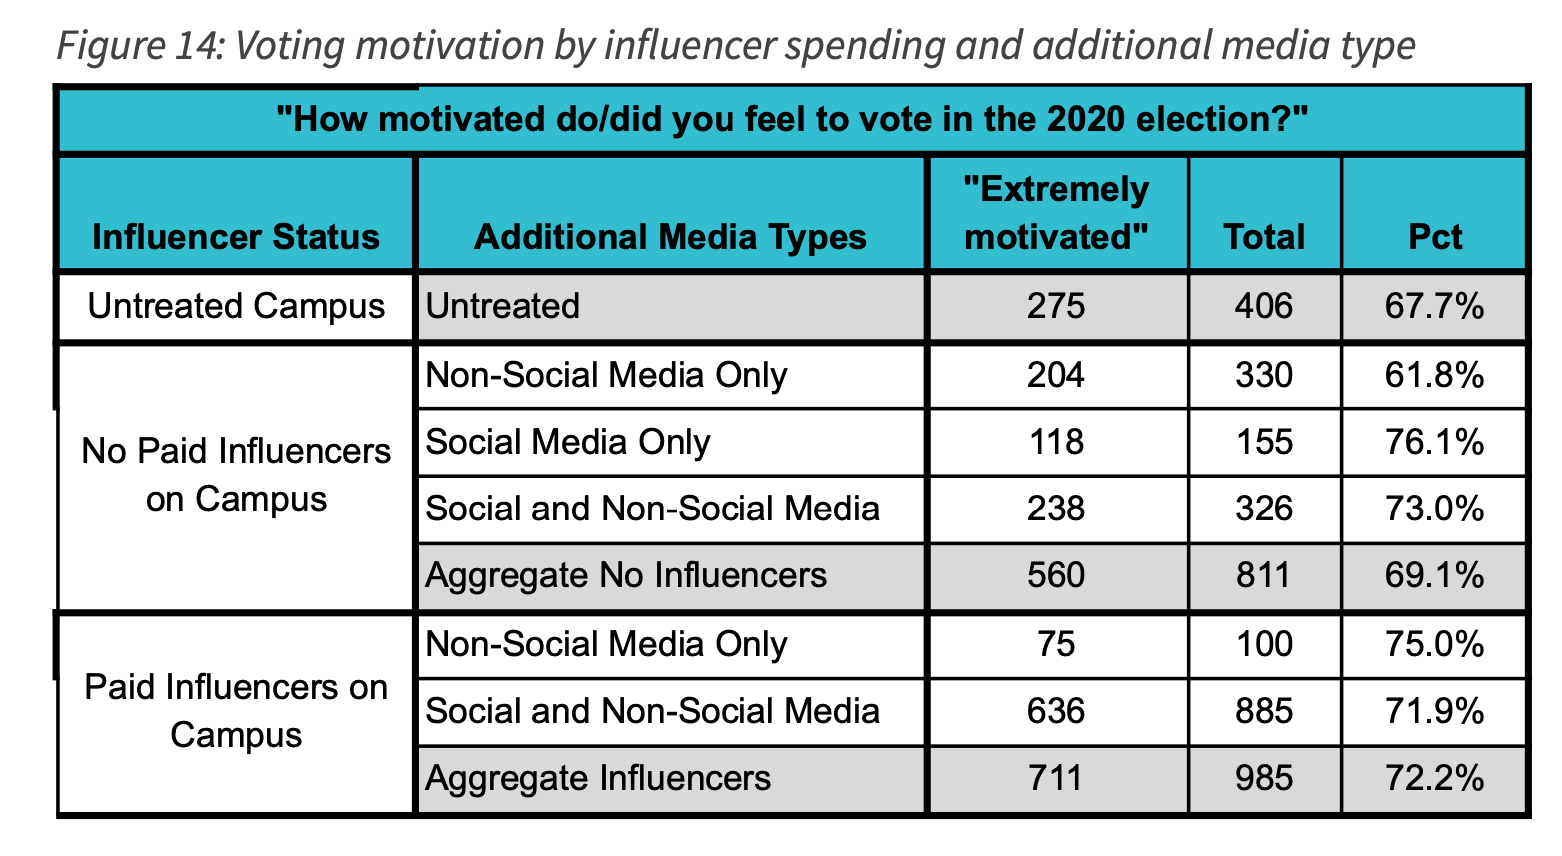
Aer cross-referencing the survey responses with Flytedeskʼs various treatment types, we saw only mild differences in respondentsʼ answers based on the treatment types -- including influencer presence -- that were implemented on their campuses. Students from campuses with paid influencers were not more likely to report having seen peers post on social media about registering to vote, nor were they significantly more likely to report enthusiasm about the candidates.
On the other hand, students on the influencer campuses were somewhat more likely to recall seeing messages about returning their ballot, and also to remember hearing a “voting is easy” type of pitch. The students from influencer-treated schools were also slightly more likely to report enthusiasm for the election. However, it is important to remember that the schools where influencers were recruited were not randomly selected, so the differences could result from other factors.
Survey Demographics
There were 2314 recorded responses to this survey spanning at least 39 college campuses and 13 states. We say “at least” because there was an option in the survey for students to enter the name of a college that was not listed, as well as an option for respondents not currently attending a college or university. Flytedesk spent money at exactly 30 of the campuses ranging anywhere from $0.01 per student (Texas A&M at College Station) to $15.65 per student (University of North Carolina at Chapel Hill). The average spend for these campuses was $4.77 per student.
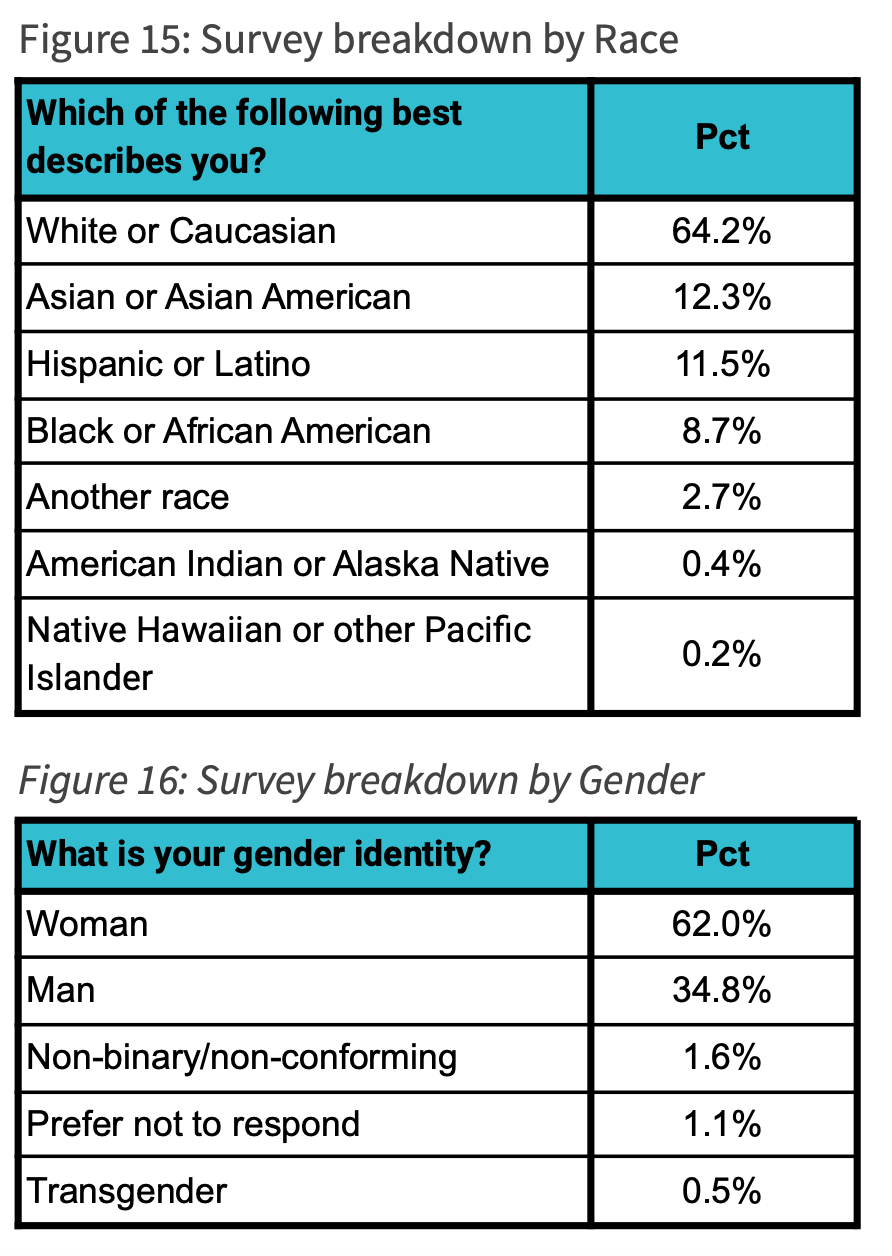
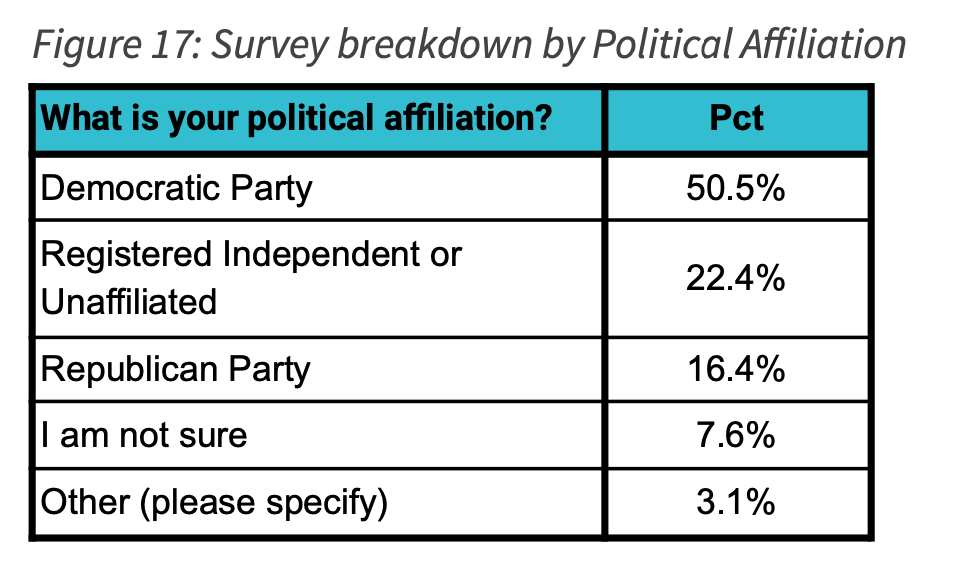
The following are three tables that give a general overview of the demographics of the survey sample. Generally speaking the survey skewed white, female, and Democratic.
Conclusion
The survey found that the students surveyed had high rates of voter registration. Their top three most important issues were Racial Justice, Climate Change, and Healthcare. They were more often than not highly motivated to participate in the 2020 election, but were overall not very enthusiastic about either of the two presidential candidates.
The survey included students from schools both treated and untreated by Flytedesk. Students at the treated campuses recalled campaign-related ads on campus significantly more oen than in the untreated group. This correlated with higher self-reported rates of motivation to vote and knowledge about voting. Additionally, students were more likely to have heard certain types of pro-voting messages if they were at campuses where paid influencers were spreading those messages. These findings are not conclusive, but do indicate promising opportunities in the future for further exploration of the effects of campus outreach.