The impact of universal vote by mail and permanent absentee voting on turnout in 2020 and 2022

Last updated January 23, 2024
Scott Minkoff, PhD (Associate Professor, SUNY New Paltz and Research Fellow, VoteAmerica). Jennifer Lauv (Data Engineer, VoteAmerica). Debra Cleaver (CEO, VoteAmerica)
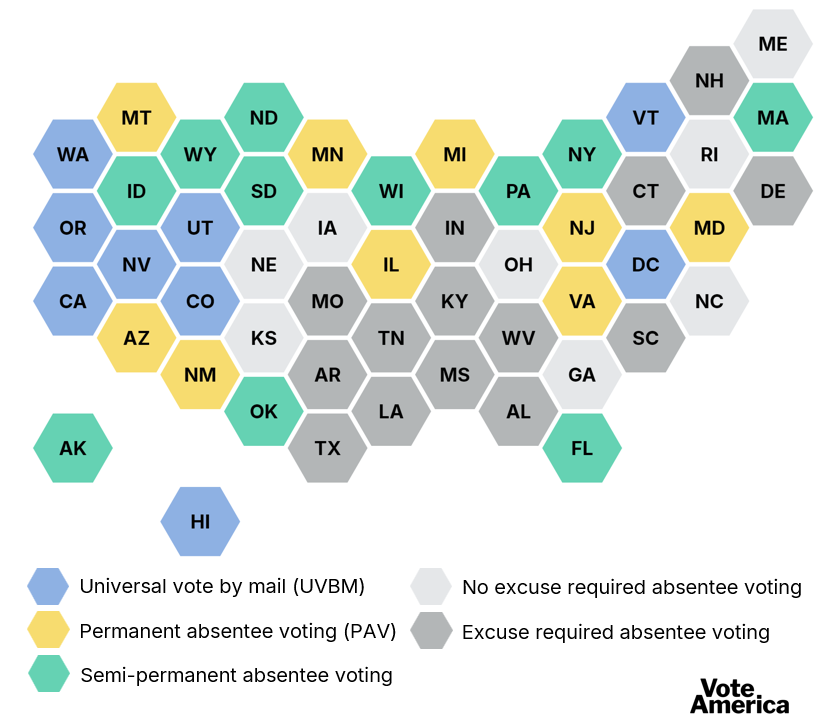
Map 1. 2024 vote by mail rules by state*
Definitions
- Universal VBM: all elections are held by mail
- Permanent absentee voting (PAV): voters can sign up once to receive ballots in the mail for at least the next 4 years
- Semi-permanent absentee voting: voters can sign up once to receive ballots for at least 1 calendar year. In Florida, one request is good for one election cycle (example: 2023 and 2024, or 2025 and 2026)
- No excuse absentee voting: no excuse required, but you can only request an absentee ballot for one election at a time
- Excuse required: only voters who can't vote in person are allowed to vote using an absentee ballot
*Minnesota will be a PAV state as of June 1, 2024. New Mexico became a PAV state on January 1, 2024.
Bullet Points
- In universal vote by mail (UVBM) states, all registered voters are sent a ballot in the mail without needing to proactively request one.
- In permanent absentee voting (PAV) states, voters can sign up once to receive ballots in the mail for all subsequent elections.
- Both methods significantly reduce the obstacles in the way of voting by automatically bringing the polling place to the voter rather than making the voter go to the polling place.
- VoteAmerica has conducted a number of analyses aimed at assessing the impact of UVBM and PAV on turnout. Here are our core findings:
- In 2020, UVBM states had higher turnout than battleground states, where battleground states are defined as those where partisan groups spent at least $90 million on broadcast TV.
- Turnout in UVBM states was higher across age cohorts. Notably, turnout among younger voters (18 to 24) in UVBM states was about 3.7 percentage points higher than in battleground states. The differences were even larger when UVBM states were compared with the states where mail voting is the most difficult.
- We took a close look at PAV in Montana and Arizona. PAV adoption is high in both states: in 2022, it was 74.1 percent of registered voters in Montana and 75.5 percent of registered voters in Arizona. The differences in turnout between those with and without PAV status were substantial.
- Overall, PAV turnout was about 30 percentage points higher than non-PAV turnout in Arizona’s 2020 and 2022 elections. The difference was about 20 percentage points for Montana. Differences persist consistently across age, gender, race/ethnic, and voter propensity groups.
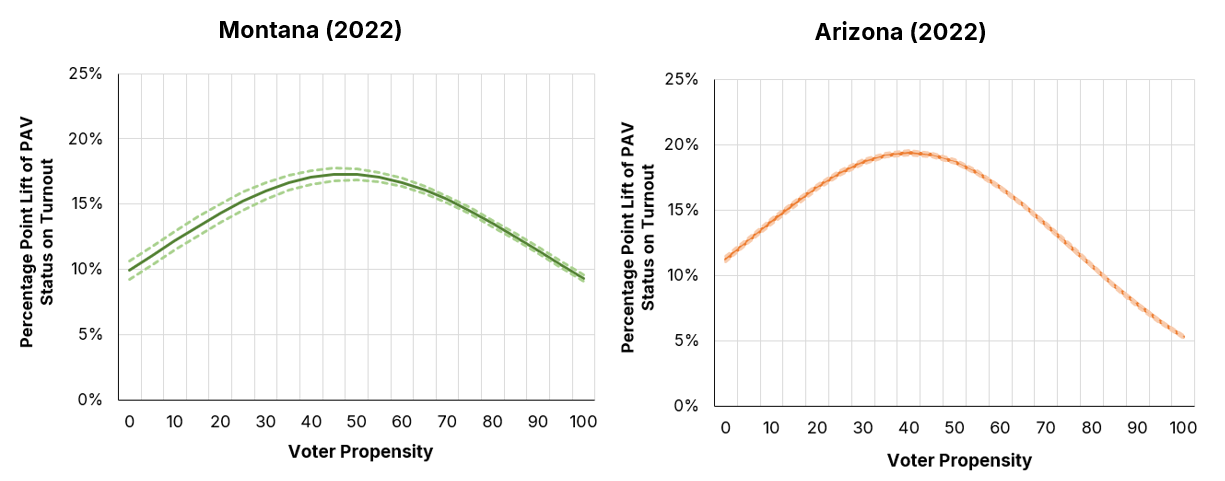
- Our multivariate individual-level analysis (that controlled for a variety of other variables, including voter propensity) found an average turnout lift from PAV of 13.17 percentage points for Montana 2022 and 12.54 percentage points for Arizona 2022.
- While states like Arizona and Montana have been using PAV for some time, it is newer in several states including DC, Maryland, Michigan, Minnesota, New Mexico, New Jersey, and Virginia. Work will need to be done to build and ease adoption among existing and new voters.
Introduction. Examining Turnout Effects for PAV and UVBM
This memo presents evidence on the efficacy of universal vote by mail (UVBM) and permanent absentee voting (PAV). With UVBM, all registered voters are sent a ballot in the mail without needing to proactively request one. With PAV (also known as “single signup”), voters sign up once to receive ballots in the mail for all subsequent elections.
Like other state voting laws (ID, early voting, etc.), UVBM and PAV may have a significant impact on whether people actually turnout to vote. Both methods significantly reduce the obstacles in the way of voting by bringing the polling place to the voter rather than making the voter go to the polling place. VoteAmerica has conducted a number of analyses aimed at assessing this impact and find that both methods substantially boost voter turnout.
Map 2: 2020 Universal vote by mail and battleground states
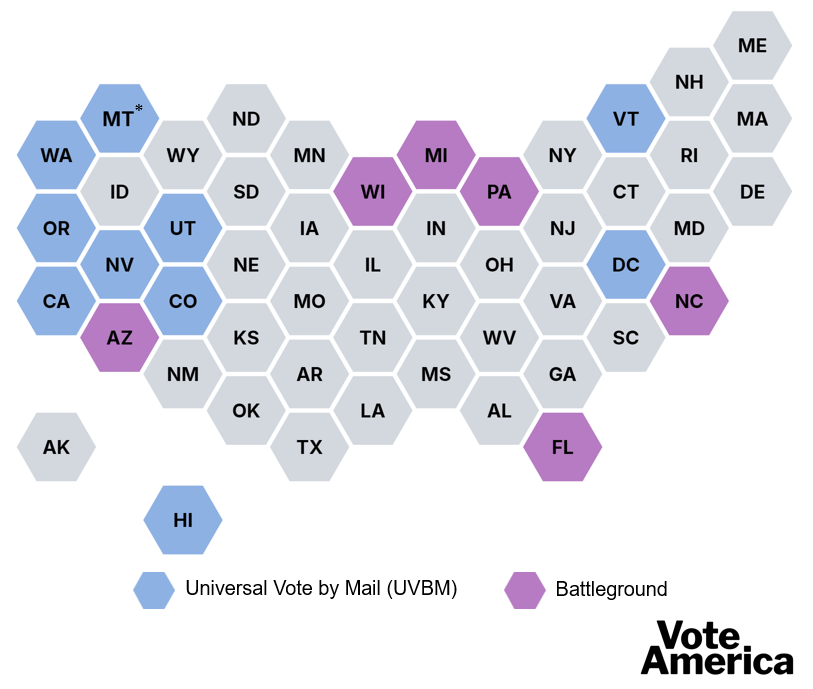
*In 2020, Montana counties had the option of using UVBM elections. 46 of 56 counties opted for UVBM.
Analysis 1. Universal Vote by Mail (UVBM)
To assess the impact of UVBM, we compared 2020 aggregate turnout in battleground states with aggregate turnout in universal vote by mail states. Battleground states were defined as those where partisan groups spent at least $90 million on broadcast television. These states were presumed to be the most competitive ahead of Election Day, they were the places where the most partisan and nonpartisan voter mobilization spending occurred, and they are the states where turnout is typically expected to be the highest. It also happens to be the case that none of them had UVBM in 2020 (see map 2 above for UVBM and battleground states). As such, battleground states provide a good, conservative comparison with UVBM: How did turnout in UVBM states compare with the states where there was the most external pressure to vote?
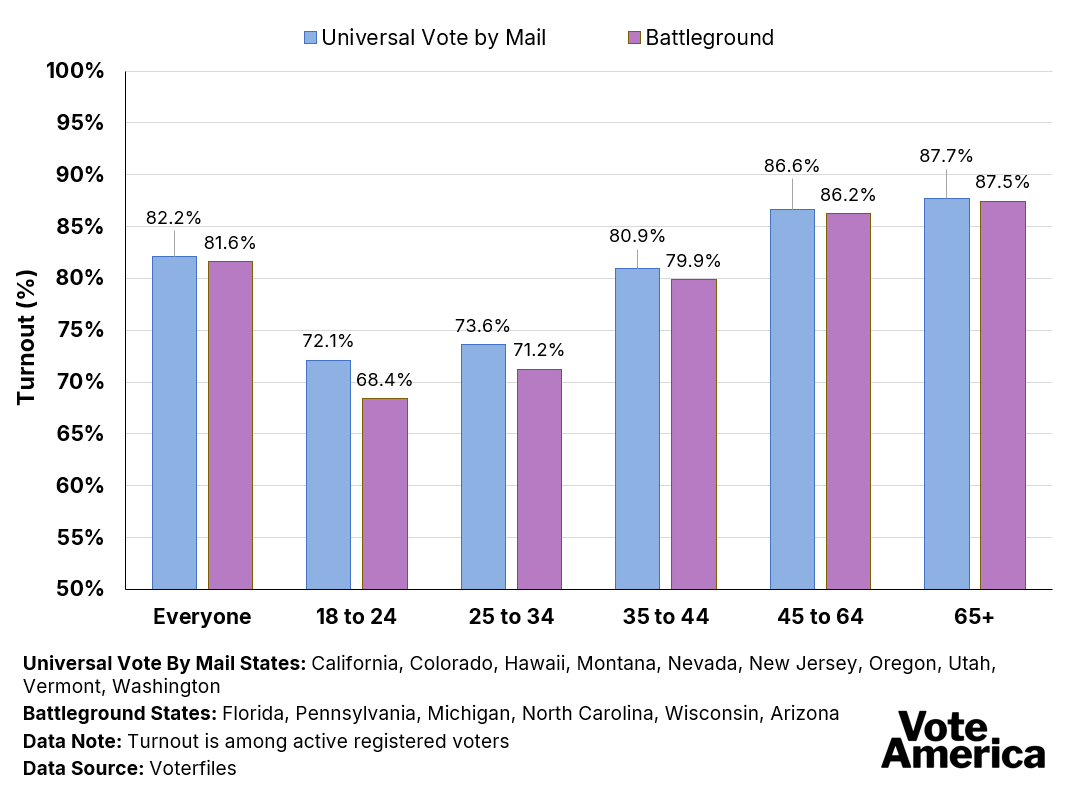
The results of this analysis are presented in Graph 1 by age cohort. Overall, we find that UVBM state turnout was slightly higher than battleground turnout in all age categories. Notably, and somewhat remarkably, turnout in UVBM states was 3.7 percentage points higher among those 18 to 24 and 2.4 percentage points higher among those 25 to 34. This suggests that UVBM can be particularly helpful at boosting turnout among younger voters.
Graph 1. Universal Vote by Mail v. Battleground States (2020): Aggregated general election turnout by age cohort
Consider Utah. Utah was not a competitive state in 2020: President Trump won by just over 20 percentage points. There was no Senate race that year and only one of its 4 House districts was remotely competitive. Spencer Cox won the governor’s race by more than 30 points. Overall turnout among active registered voters was 89.33 percent, which is higher than any of the battleground states except Wisconsin (which had a turnout rate that was only 0.21 points higher).
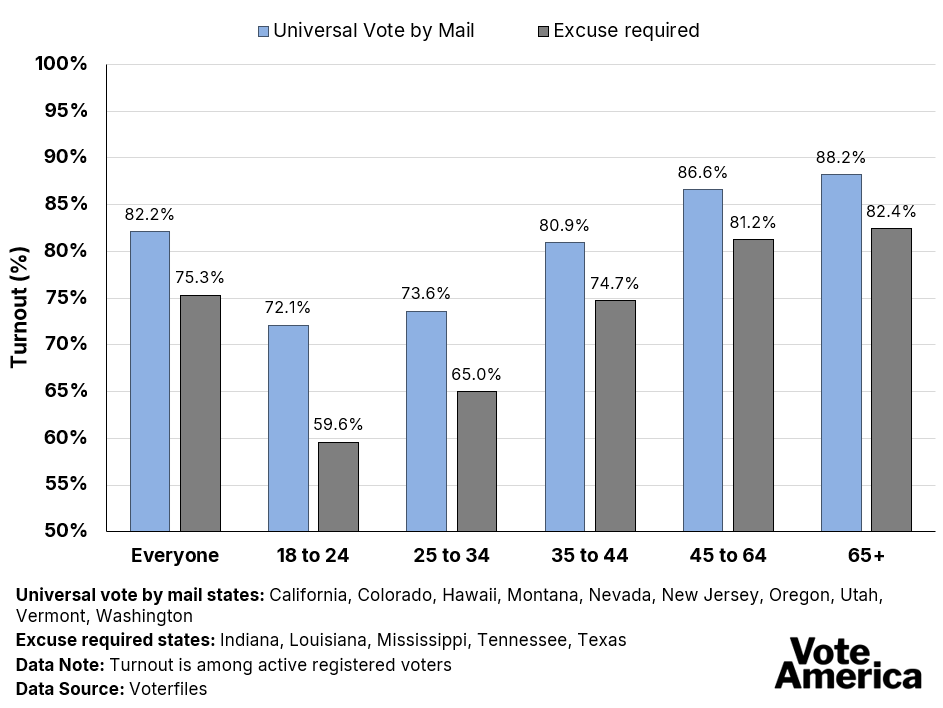
An even starker contrast appears when you compare UVBM states with the states that were the least supportive of vote by mail in 2020. These are states that require an excuse to receive an absentee ballot and some also require a witness signature on the ballot. The states that required an excuse in 2020 were Indiana, Louisiana, Mississippi, Tennessee, and Texas (note that many states waived their excuse requirements during the pandemic). Not surprisingly, turnout among voters in UVBM states was 6.8 percentage points higher than in the states that made it difficult to vote by mail. The difference was biggest among the youngest voters with UVBM turnout higher by 12.5 percentage points among those 18 to 24 and 8.6 percentage points higher among those 25 to 34.
Graph 2. Universal VBM states v. excuse required states (2020): Aggregated general election turnout by age cohort
Analysis 2. Aggregate PAV analysis for Arizona and Montana
To evaluate the effect of PAV status on turnout, we turn to three elections across two states where PAV was an option for voters: Arizona in 2020 and 2022 and Montana in 2022. PAV status varies among voters within each state that offers it (some people have opted in, some have not). This means we can hold state election-effects constant and simply examine how PAV status influences turnout in the state, no need to compare across state lines.
We conducted both an aggregate and an individual-level analysis to identify the turnout effects of PAV. The aggregate analysis simply compares turnout among those with and without PAV status, broken down by age and voter propensity. The individual analysis uses a statistical model to estimate the average change in the likelihood of voting associated with PAV status, controlling for other factors typically associated with turnout. Both analyses yield the same result: PAV status significantly boosts voter turnout.
Graph 3. Montana and Arizona (2022): Permanent absentee voter (PAV) status by group
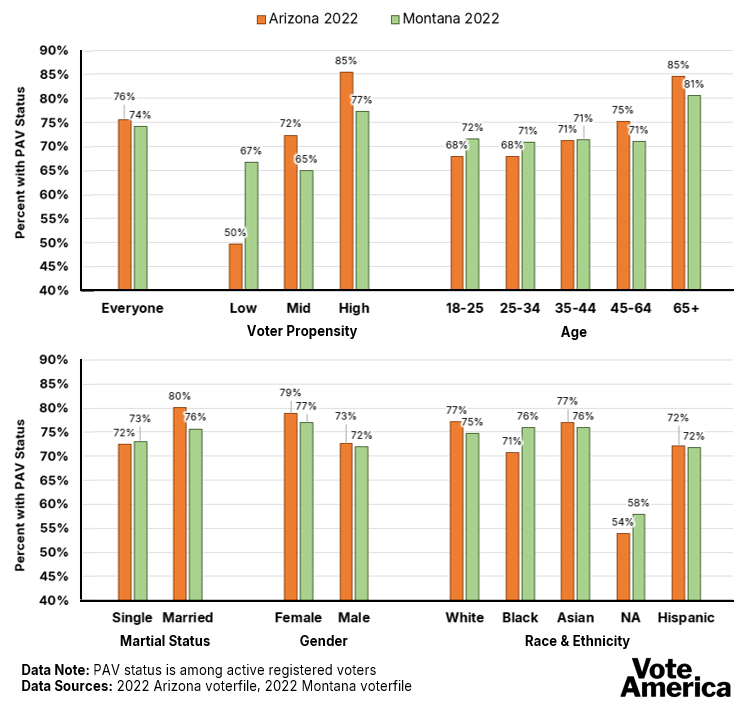
PAV adoption is high in both states: In 2022, it was 74.1 percent of registered voters in Montana and 75.5 percent of registered voters in Arizona. Graph 3 shows PAV adoption across levels of voter propensity and demographic groups. PAV adoption mostly increases with voter propensity. PAV status among low-propensity voters in Arizona is notably low (below 50 percent) relative to the other propensity groups. We also observe that PAV adoption rates increase with age and are at least slightly higher among women (relative to men), those who are married (relative to those who are single), and those who are White or Asian (relative to those who are Black, Hispanic, or Native American). In particular, PAV status among Native Americans is below 60 percent in both states.
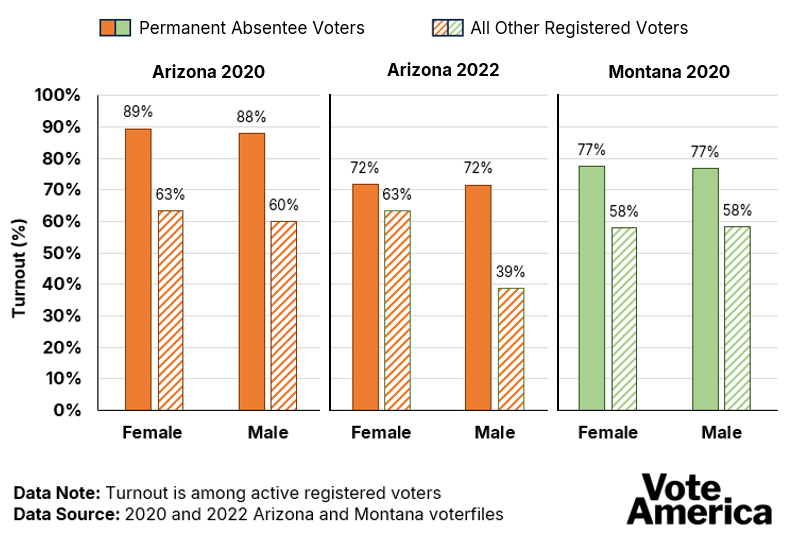
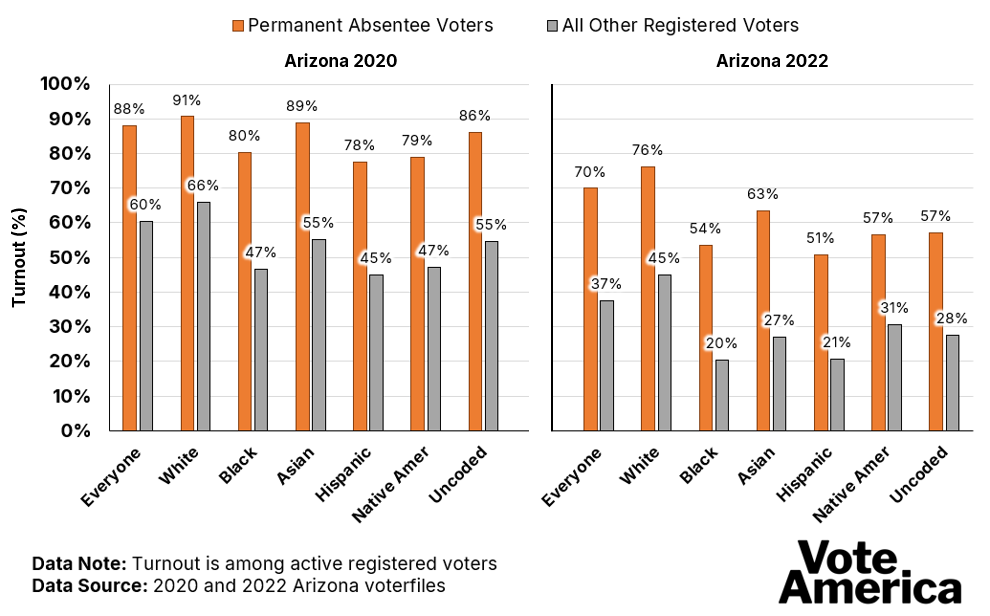
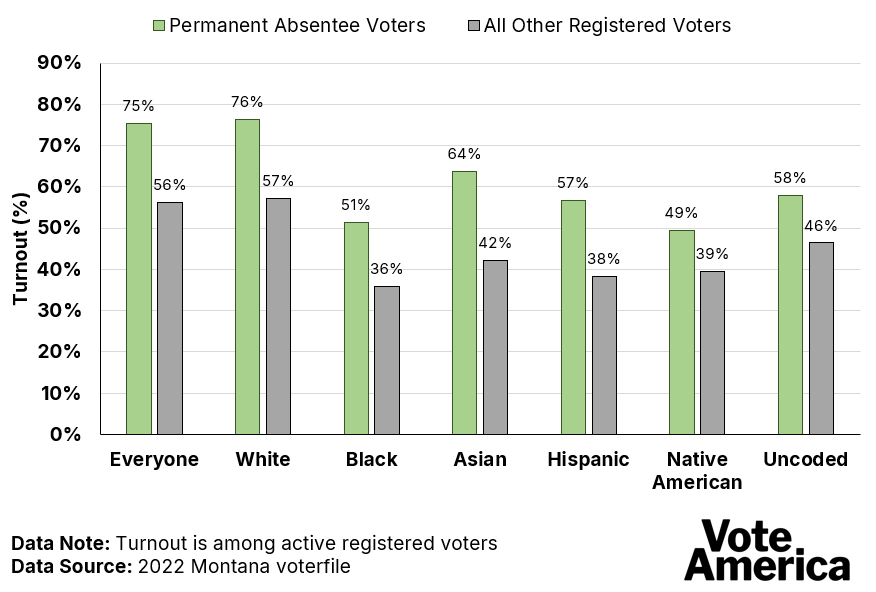
When we compare turnout between registered voters who have and have not adopted PAV, we find that turnout is substantially higher among those who have opted-in to PAV. This is true in both states and across age cohorts (graphs 4 and 5), gender groups (graph 6), race/ethnicity groups (graphs 7 and 8), and voter propensity groups (graphs 9 and 10).
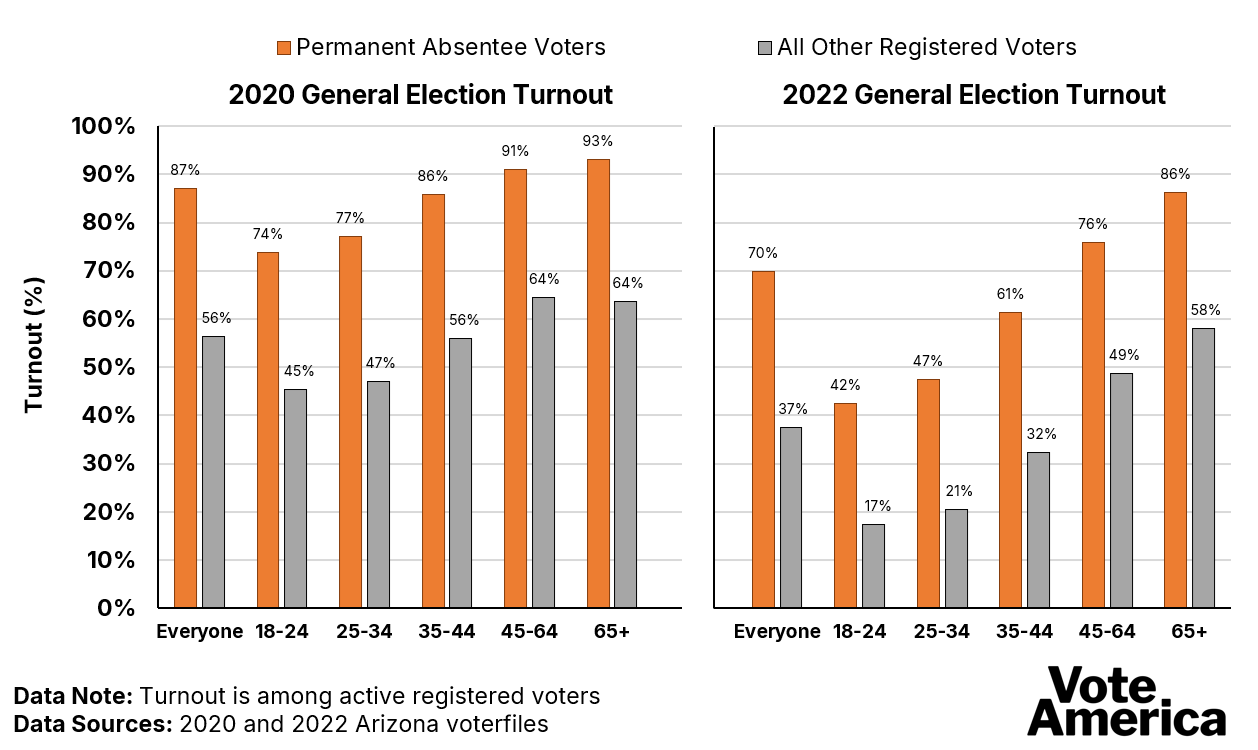
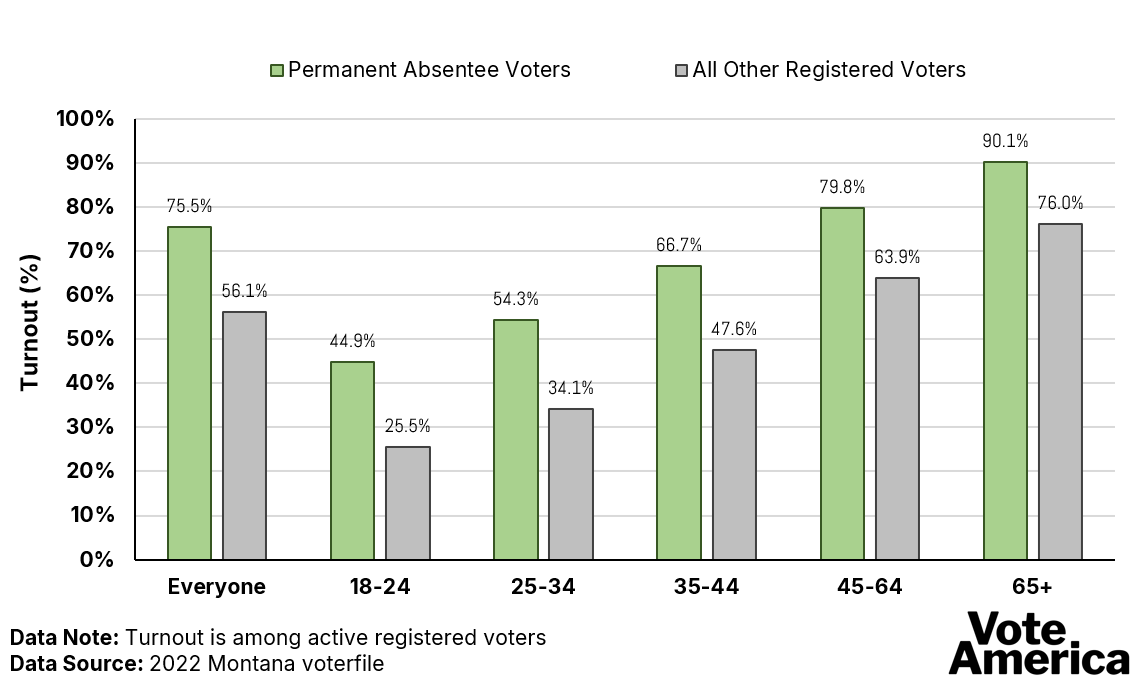
In Arizona, there is a consistent difference of just less than 30 percentage points overall and across age cohorts. In Montana, the difference is about 20 percentage points overall and between 15 and 20 percentage points across age cohorts, with higher differences among younger voters. With respect to gender, we observe turnout differences between 18 and 30 percentage points. Notably, the turnout gap is greater among men such that PAV sign-up boosts turnout among men a bit more than it increases turnout among women. The differences across race and ethnic groups look similar; interestingly, the turnout difference is consistently greater among the non-white groups in all three elections. For example, PAV turnout was 24.7 percentage points higher among white people in Arizona’s 2020 election, but 33.6 percentage points higher among Black voters, 33.7 percentage points higher among Asian voters, 32.6 percentage points higher among Hispanic voters, and 31.7 percentage points higher among Native American voters.
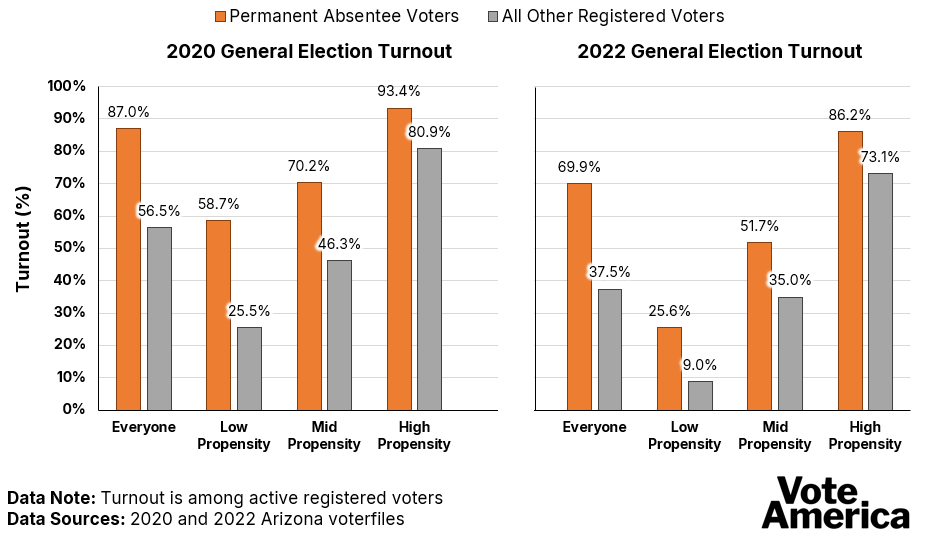
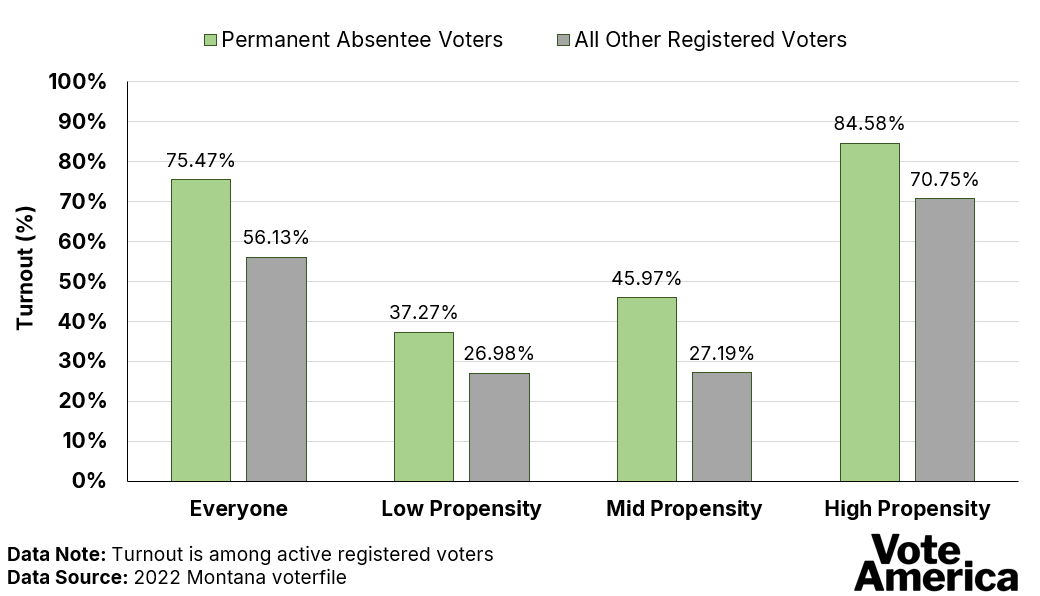
When comparing across voter propensity groups, we find that the turnout difference is largest among lower-propensity voters. By way of example, in Arizona 2020, PAV turnout was higher by 33.3 percentage points among low-propensity voters, 23.9 percentage points among mid-propensity voters, and 12.5 percentage points among low-propensity voters. In Arizona 2022 and Montana 2022, the differences were a bit less but PAV voters still turned out at a much higher clip than non-PAV voters.
Analysis 3. Voter-level PAV analysis for Arizona and Montana
While these aggregate turnout analyses have the luxury of being very straightforward, they lack the ability to control for multiple variables simultaneously so as to ensure that the observed effect of PAV is not being impacted by some other variable – this is particularly helpful for understanding the impact of voter propensity because it is a function of other variables. To accomplish this goal of better isolating the effect of PAV, voter-level 2022 turnout models were estimated for Montana and Arizona that included a variable indicating whether the person had PAV status or not, while controlling for county turnout, voter propensity, age, marital status, gender, and race/ethnicity.
In these analyses we find that the average turnout lift from PAV status was 13.17 percentage points for Montana and 12.54 percentage points for Arizona. Like most voter mobilization tactics, we also find that this effect was largest among mid-propensity voters (see Graph 8). For mid-propensity voters we observe a turnout boost between 15 and 20 percentage points, compared to a boost between 5 and 10 percentage points for low- and high-propensity voters. The aggregate analysis above found that the biggest PAV-related turnout gap was among low-propensity voters. This remains true, but this individual analysis indicates that once other variables are controlled for, it is the mid-propensity voters that get the biggest bump from automatically receiving a ballot in the mail. Additionally, the effect of PAV reduces slightly with age. For example, PAV lift for an 18 year old Montanan was about 13.71 percentage points compared to 11.24 percentage points for an 83 year old Montanan. The difference was slightly less in Arizona.
Graph 4. Arizona Permanent Absentee v. All Other Registered Voters (2020 & 2022): General election turnout by age cohort
Graph 5. Montana Permanent Absentee v. All Other Registered Voters (2022): General election turnout by age cohort
Graph 6. Arizona and Montana Permanent Absentee v. All Other Registered Voters (2020, 2022): General election turnout by gender
Graph 7. Arizona Permanent Absentee v. All Other Registered Voters (2020, 2022): General election turnout by race and ethnicity
Graph 8. Montana Permanent Absentee v. All Other Registered Voters (2022): General election turnout by race and ethnicity
Graph 9. Arizona Permanent Absentee v. All Other Registered Voters (2020 & 2022): General election turnout by voter propensity
Graph 10. Montana Permanent Absentee v. All Other Registered Voters (2022): General election turnout by voter propensity
Graph 11. Montana and Arizona (2022): Effect of PAV status on turnout at different levels of voter propensity (with 95% confidence interval)