2019 campus advertising program evaluation

The effects of college advertising on 2019 turnout in Kentucky, Louisiana, and Mississippi
Analysis by Pantheon Analytics. Program designed by Debra Cleaver (VoteAmerica), Alex Kronman (Flytedesk), and Christopher Mann (Skidmore College). Originally published on October 15, 2020.
Executive Summary
During the 2019 gubernatorial elections in Kentucky, Louisiana, and Mississippi, Flytedesk, a campus advertising platform, partnered with a national civic organization to run a randomized controlled trial to evaluate the effectiveness of their program. Target campuses were divided into treatment and control groups. Treatment campuses received messages targeted around key dates: National Voter Registration Day, the state specific voter registration deadlines, and the GOTV period. Surveys were conducted across all campuses to gather data on the students in each group of campuses before and after the treatment. These survey respondents were then matched to the voter file.
Among the matched records, turnout increased by approximately 8 percentage points on treatment campuses relative to the control. The completeness of survey responses varied by school and survey wave, meaning match rates to the voter file were unreliable for analysis of treatment effects on registration. However, within the nearly 1,500 matched records we have more confidence about the turnout effect, particularly since the effect size remained the same when using regression analysis with various controls.
Background
Flytedesk, a campus advertising platform, partnered with a national voting-focused organization to show ads to increase student participation in the 2019 gubernatorial elections in Kentucky, Mississippi, and Louisiana.1
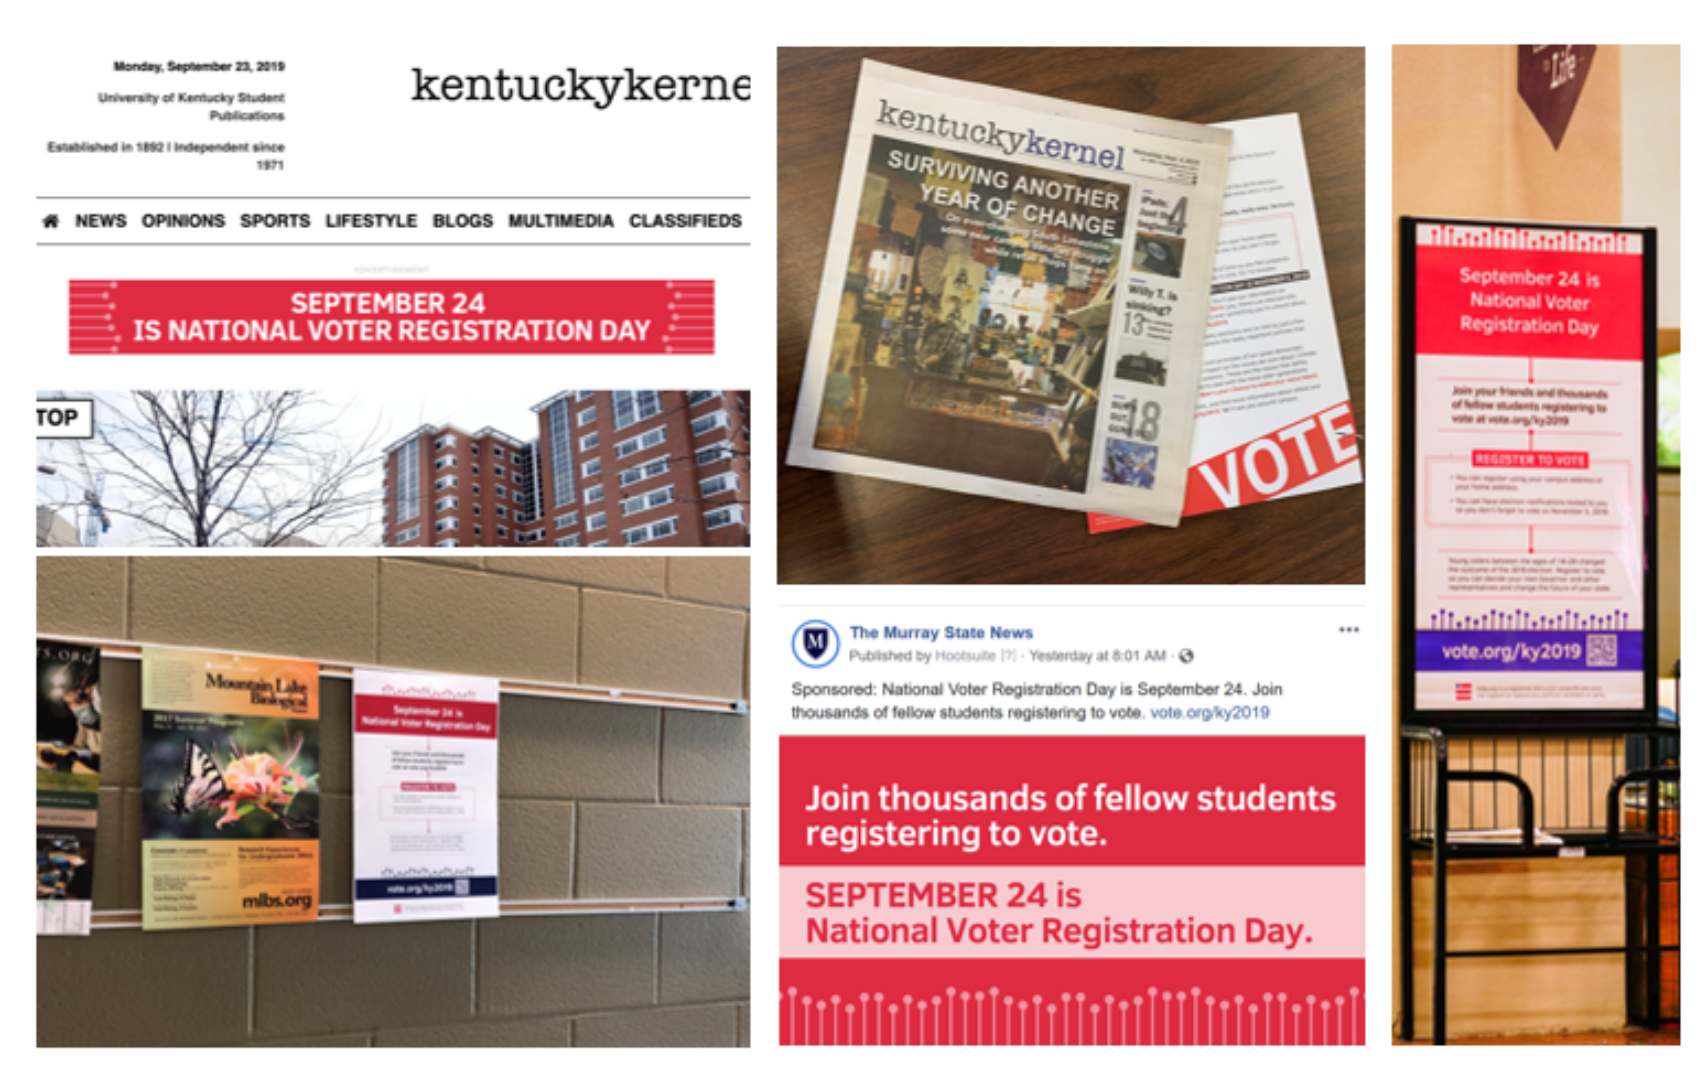
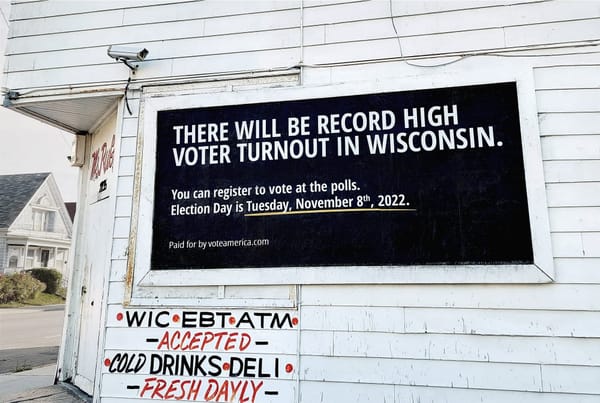
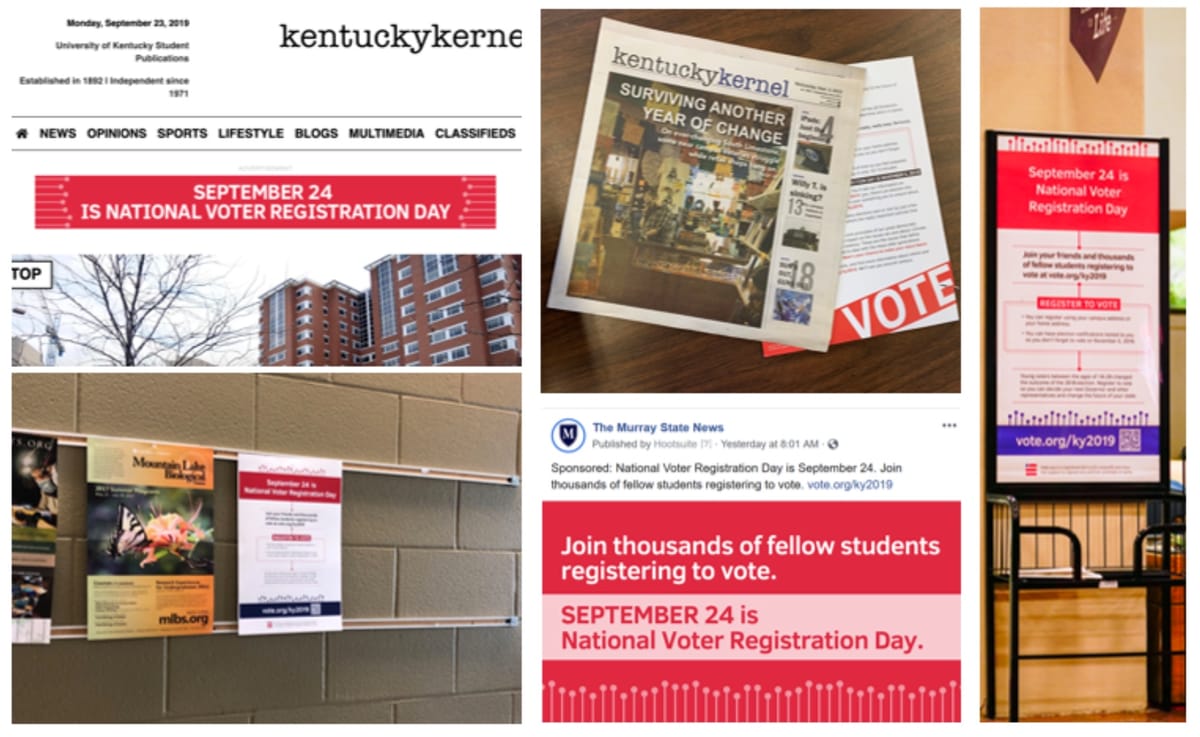
The ads appeared in a mix of media such as campus billboards, student newspapers, targeted digital, posters, flyers, and bar coasters displayed throughout the campuses (see Appendix II). The ads were also timed to events within the late election cycle such as National Voter Registration Day, the deadlines for registration, and GOTV.
In order to observe the effectiveness of the ads, the 33 target campuses were divided into treatment and control groups. Ads were displayed only in campuses assigned to the treatment group. Surveys were conducted on the student populations in both control and treatment groups before and after the treatment.
Methodology
Two survey files were the primary inputs for this analysis: a pre treatment survey and a post treatment survey. Survey responses were primarily collected via on-campus volunteers interviewing students and recording their responses via iPad. The survey datasets were uploaded to Civis’ Platform and matched against the available voter file. For our post-election analysis purposes, there is not a great deal of difference between the pre- and post-treatment surveys; both are merely sources of voters from the campuses in question. Still, our analysis will show results for these two sources both separately and combined.
When matching a list against the Civis voter file, Civis returns a score (0-1) indicating the level of confidence in each particular match. Their default threshold for returning a match is set to 0.8, which is what we used throughout this analysis.
Approximately half of the pre-treatment survey list matched to the voter file, while 29% of the post-treatment survey list matched to the voter file. This is likely due to collection method differences between the two surveys; many more of the post-treatment survey respondents failed to enter their name or other information. The name field was blank in approximately 9% of records in the pre-treatment file and approximately 23% of records in the post treatment file. While names are not in theory necessary for a match, when other information like address, phone number, or email address might be provided this speaks to the variability in data quality observed in the file. Overall, these match rates are not unusually low for a college population.
The matched survey respondents were compared across treatment and control groups, with particular attention to the difference in turnout among the matched voters. Regression analysis was then performed to ensure that other confounding factors were not unduly influencing the results.
Results
While match rates were not identical between the treatment and control groups, particularly in the pre-treatment survey, we do not believe this reflects a meaningful difference between the groups. Instead, as Appendix I shows, the match rates varied considerably across the various campuses. This likely reflects differences in the efficacy of the individual survey administrators on each campus. However, among those voters who did match within each group, we have a fair degree of confidence that the treatment and control groups are good equivalents.
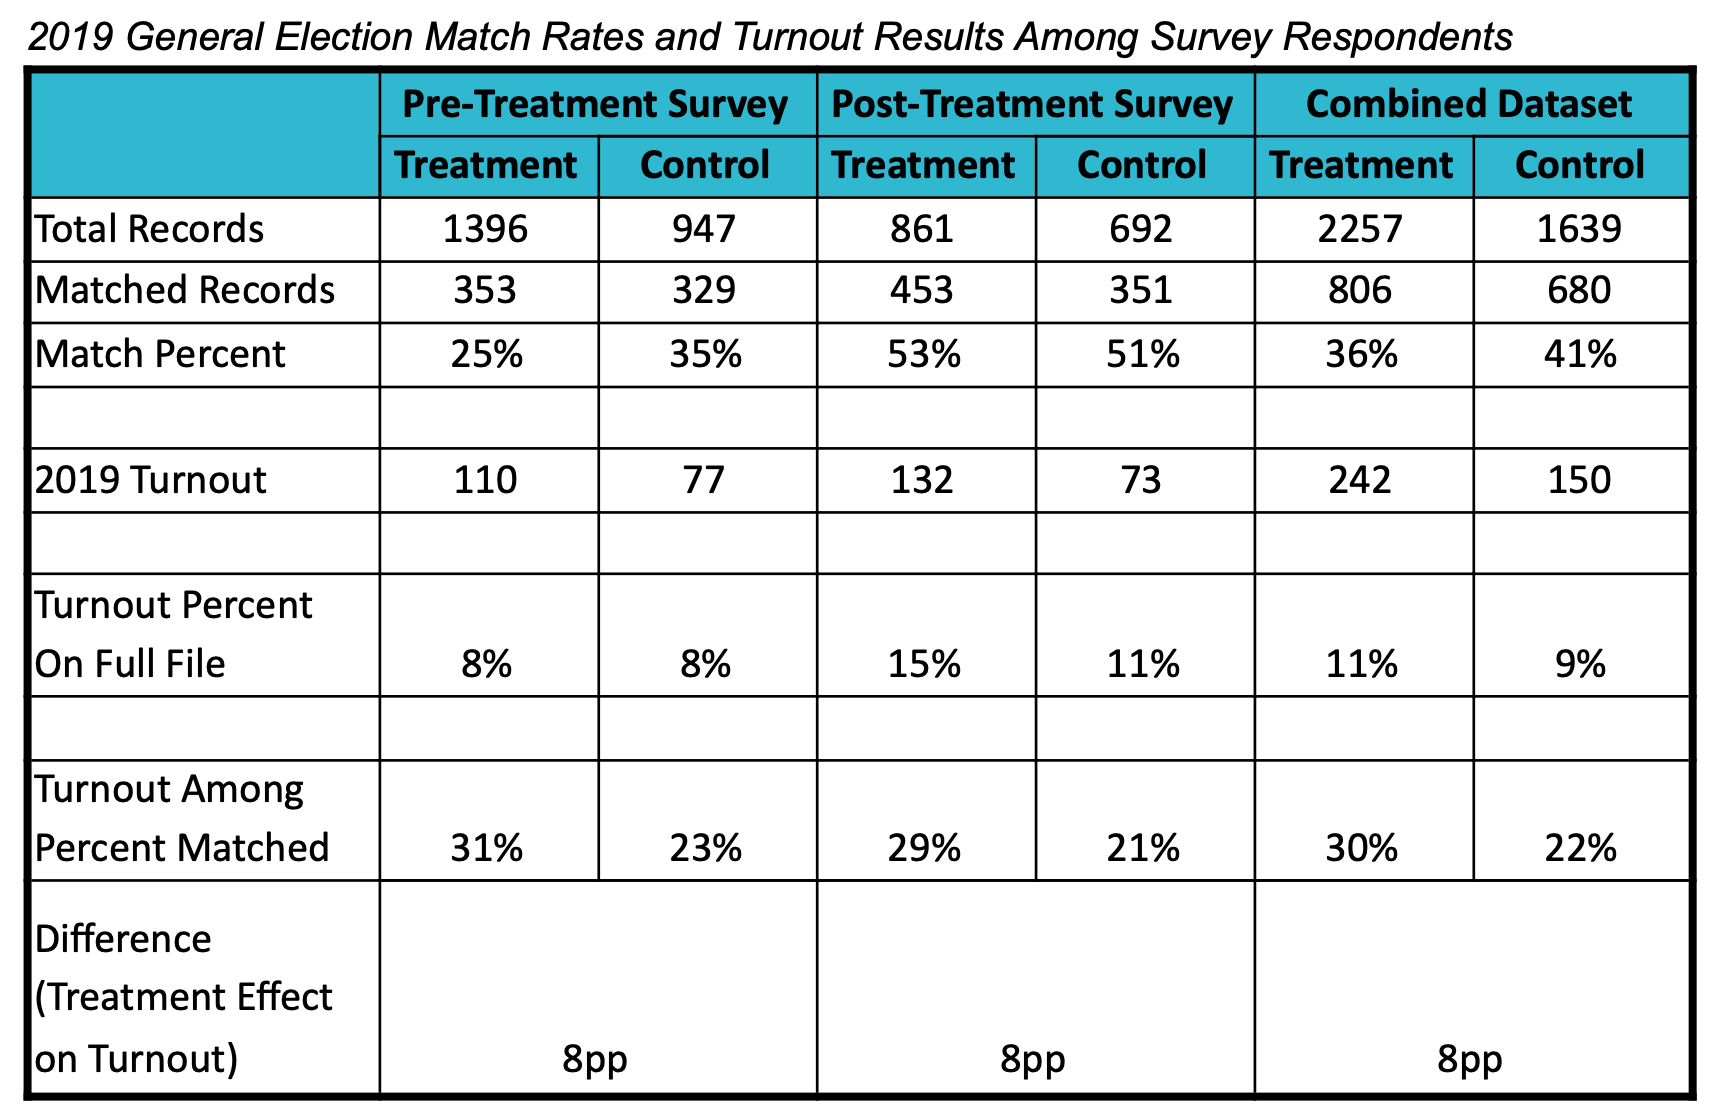
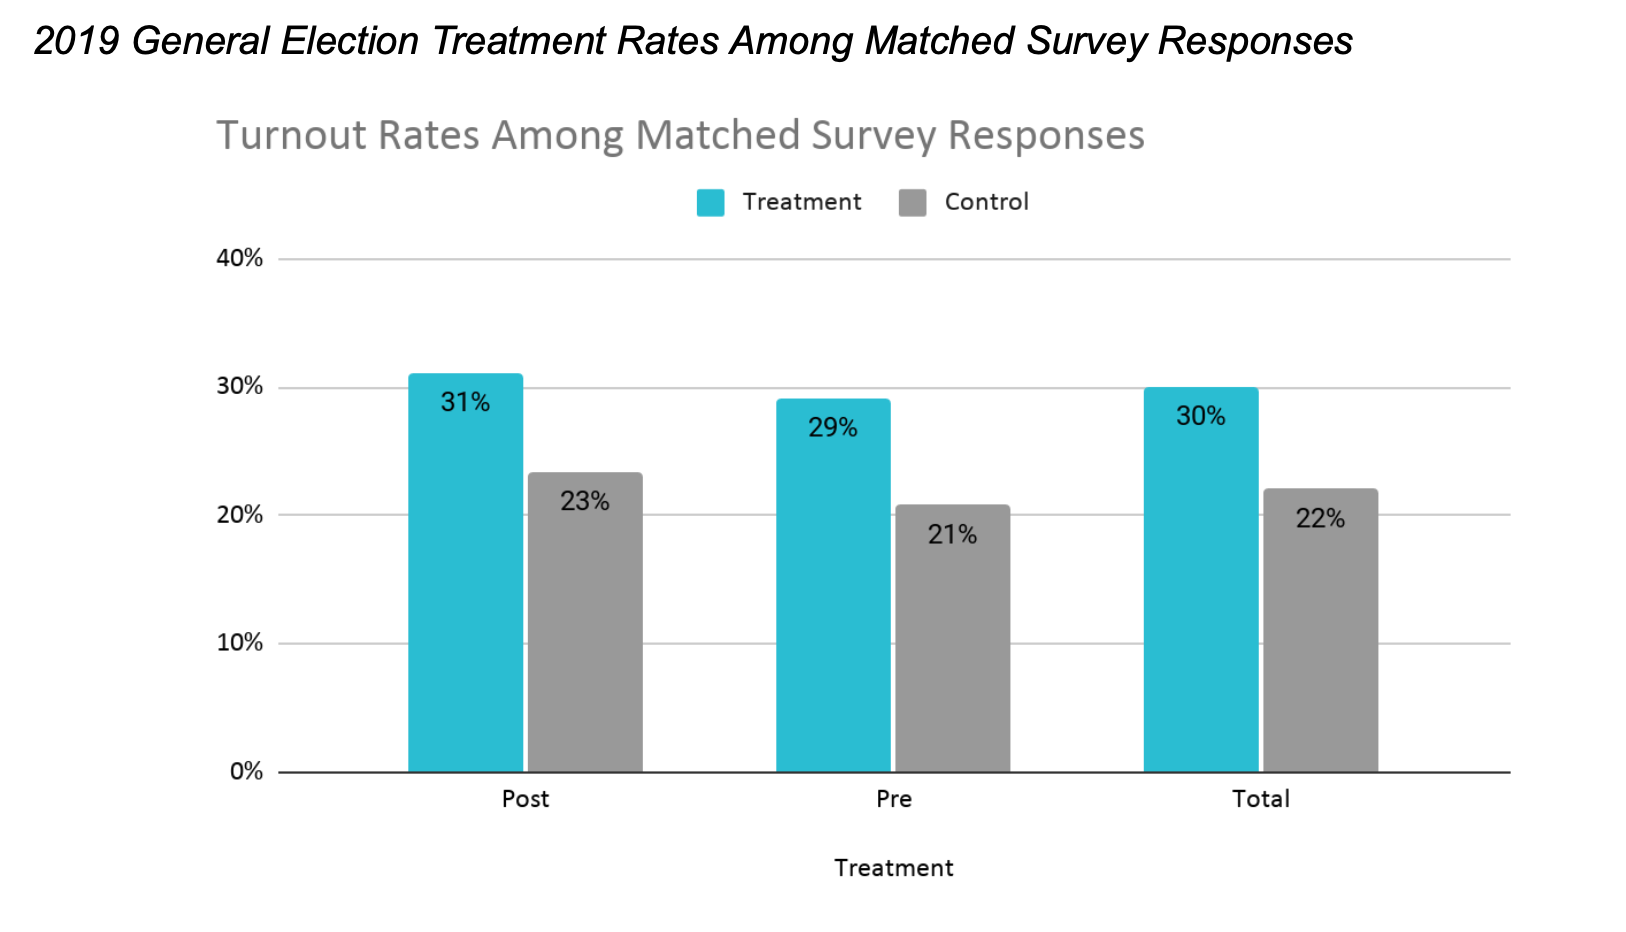
Among the survey-takers who matched to the voter file, turnout was higher by eight percentage points on the treatment campuses than on the control campuses. This is a large turnout effect in the world of political interventions. Typically a successful GOTV program will produce one or two percentage points of increased turnout. The results above (also shown below as a chart) indicate that the Flytedesk ads had an unusually positive effect on turnout rates.
Could this large effect be due to hidden, pre-existing differences between the voters in the treatment and control groups? It is always tricky to rule out selection biases when using data based on voluntary (non-sampled) survey data. Likewise, given that this experiment was randomized at the campus level with 33 total schools, it is possible that even without intervention there would have been some differences in average turnout across the control and treatment groups.
To rule out confounding factors, we ran some simple regressions. In particular, we included as a control variable the 2019 turnout score for each individual. Turnout scores incorporate a variety of information about each voter, particularly demographic and vote history variables, to produce a predicted likelihood of voting in a given election year. We then added a control for age, on the chance that the survey respondents on different campuses might happen to be age-distributed unevenly (more freshmen here, more seniors there, etc). Additional control variables were added for race and responses to a survey question asking students about how confident they were that they know how to vote. The latter control was intended to adjust for any differences in preparedness that students may have had, which could also conceivably correlate with school-level differences (such as in-state vs. out-of-state mover ratios).

When including the various controls the effect size remains positive and statistically significant. Notably, no matter which controls are included, the effect size always hovers close to the 8% mark seen in the raw analysis. This gives us confidence that confounding factors are not likely to be responsible for the treatment effect.
Conclusions
Overall the Flytedesk program appears successful in it’s goal of increasing campus turnout. The registration efforts appear to be inconclusive based on the varying data quality from campus to campus.
It’s worth pointing out that this magnitude of treatment effect may or may not apply in all elections. For instance this effect size would be extremely high – and thus probably harder to achieve – in a presidential election. These 2019 elections were likely lower in salience given that 2019 was a non-federal election year. Statewide turnout in Kentucky was 42%, 51% in Louisiana (11/16/19), and approximately 42% in Mississippi. Turnout among our survey-takers was substantially lower than those figures, though that is expected given that it is a younger population as well.
Another important consideration is that our conclusions here are focused on survey takers who were successfully matched to the voter file. It is possible that survey takers are different from the broader campus populations in some ways that bias the treatment effect. Similarly, survey takers whose information can be matched to the voter file could be different from those who did not provide adequate information to make the match. This bias could point in either direction. Perhaps the people who took the survey (either via on-campus survey administration or via email list recruitment) were also more likely to have seen the ads than people who did not take the survey. Conversely, we could guess that people who diligently fill out a survey might already be more civically engaged, and therefore less responsive to treatment than the unknown number of students who saw the ads but did not take the survey.
One kind of bias that seems unlikely, though, is that the treatment itself biased survey collection with regard to turnout, since both waves of the survey showed a similar pattern in changed turnout on the treatment and control campuses. However, it’s possible that the treatment may have biased the match rate since that was higher post-treatment. This again depends a lot on survey administration which appears to have been inconsistent from campus to campus, and therefore could have been inconsistent across the two waves of survey collection as well..
This analysis does not necessarily point to which aspects of the program were most effective. Since one wave of advertising was focused on GOTV it might suggest that that was particularly effective, but we cannot disaggregate the effectiveness of the different waves in this analysis.
But the program overall appears to have been successful at the primary goal of increasing student turnout. Eight percentage points is a significant contribution to voting rates, particularly among a historically underperforming age bracket. We recommend further exploration of these types of ad campaigns in additional election years to verify the effects and to understand how different baseline levels of turnout may change the effect size.