2019 Kentucky, Louisiana, Mississippi, and Virginia billboard evaluation

Program design by Debra Cleaver (VoteAmerica). Program execution by a national civic organization (NCO). Program evaluation by Scott L. Minkoff, Ph.D. & Christopher B. Mann, Ph.D.
Executive Summary
For the 2019 election, NCO continued its voter mobilization billboard program in four states: Louisiana, Virginia, Mississippi, and Kentucky. In an effort to evolve our understanding of how effective billboards are at increasing voter turnout, a randomized field experiment was developed and implemented. This field experiment utilized a fishnetting research design that divided the research areas into cells and compared individual-level turnout between cells that were randomly assigned to be treated with a voter mobilization billboard and a control group. The results of the experiment indicate that billboards have a small positive effect on turnout (average cost per net vote of $23.64). However, the results also suggest the need for further research into the conditions under which billboards are most effective.
Challenges and Lessons from Prior Research
Gauging the effectiveness of billboards on turnout presents a variety of research challenges. Foremost among those challenges is that it is difficult to know who is actually exposed to a billboard and who is not. Relatedly, their exposure location and their voting location are generally not the same because billboards are viewed by people in vehicles as they travel. While these challenges can be partially overcome with careful research design, they remain critical limiting factors.
For the non-experimental analysis of NCO’s 2018 billboard campaign, a proximity strategy was used where moderate-propensity voters who lived closer to a billboard were found to be slightly (but statistically significantly) more likely to have voted than those who lived farther away (comparing over distances as great as 10 miles from NCO billboards). As part of that research design we discussed that the impact of certain billboards (such as those along highways) on turnout cannot be ascertained – we do not have a very good idea of who sees them or where they live and vote. To deal with this, we took an approach that differentiated between billboards we thought could have an observable nearby effect and billboards we did not think could have an observable nearby effect. We called this a “spatially proximate observable effect” (SPOE) and determined that the billboards for which we were most likely to see an SPOE were the ones located in more residential areas and commercial areas adjacent to residential areas. As such, we limited the 2018 analysis only to the NCO billboards for which we thought there would be an SPOE.
The SPOE approach is an intentionally conservative one. If billboards do have an impact on turnout, it is almost certainly the case that that impact is not constrained to the potential voters that live close to it. Put differently: the SPOE approach looks for an effect where one can plausibly be seen, and if one is found, it can be reasonably inferred that the effect extends beyond that space.
The 2019 Research Design
The 2019 election offered a good opportunity to further assess the value of voter mobilization billboards. As an off-year election, there was substantially less going on in the political world that was exerting pressures on turnout. The elections were less salient and we expected the billboards to be competing with fewer other voter mobilization efforts.
The development of the 2019 research design commenced prior to the purchasing of the billboards. As with previous billboard efforts, NCO was committed to primarily placing billboards in areas with historically lower turnout. This time, however, a list of potential billboards that met NCO’s turnout and budgetary constraints and loosely met SPOE criteria were requested from the billboard purchasing agent and an experimental approach was used to determine if they would actually receive a NCO mobilization billboard or not.
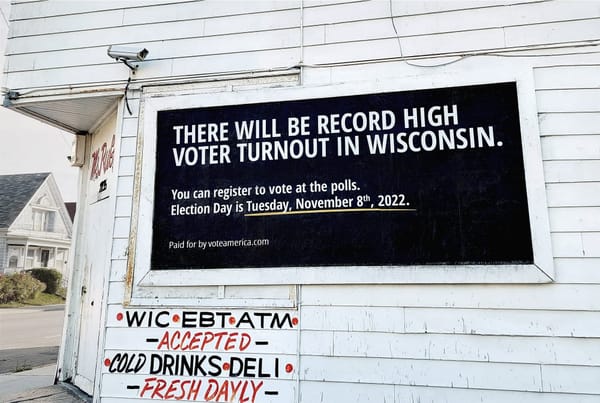
The four study areas included Louisiana, Mississippi, and parts of Virginia (the Norfolk and Richmond areas) and Kentucky (Louisville). See Table 1 for a list of elections in each state. The assignment strategy involved laying a grid (known as a “fishnet”) over a map of each research area. Each fishnet had cells that were 3-miles by 3-miles and had a random starting point so as to create equally-sized geographic boundaries that were independent of existing geographic boundaries. Fishnet cells were then randomly assigned to be treatment cells or control cells. Any proposed billboard in a treatment cell was then purchased from the vendor while billboards in control cells were left un-purchased (meaning they could be purchased by any other entity for any purpose). Treated billboards (see Figure 1) were non-partisan voting reminders that contained the word “vote” and the relevant voting day. They also had NCO logo on them.

It was important that the field experiment have both treatment cells and control cells. Areas that received the billboard treatment cannot be directly compared with the rest of the state. Areas with billboards are likely systematically different than areas without billboards on many characteristics related to voter turnout. On average, areas with SPOE billboards are likely to be more commercial and industrial (and less residential) and have more lower-income residents than areas without billboards. As such, it is important to compare among areas with billboards.


This assignment strategy is visualized for Virginia in Figure 2 above. The map shows the fishnet laid over the state with cells shaded to indicate whether they were randomly assigned the treatment condition (gray) or the control condition (white). The dots represent the full list of potential billboards presented to NCO for purchase. All billboards that fell into a gray treatment cell were purchased (colored green here) while the billboards in the white cells were not purchased (colored red here). The same process was used for each of the four research areas. The effect of the billboards is assessed based on comparing individual-level voter turnout in treatment cells and control cells. Individuals residing in cells that did not have a treatment or control billboard were removed from the analysis.
An alternative to using the fishnet boundaries for random assignment would have been to use existing political or Census boundaries. However, the fishnetting procedure has notable advantages. Billboards are along roads and roads often serve as geographic boundaries for political and Census divisions. This leads to two problems. First, it means that billboards are more likely to fall along the edge of a Census boundary, potentially obscuring its effect. Second, billboards are often on both sides of the road (facing oncoming traffic). When Census boundaries split a road down the middle (as they frequently do), this can lead to one side of the road getting a treatment billboard and one side of the road getting the control billboard, which may also obscure the effect. While both of these problems can still occur with the fishnetting procedure, it is going to occur less often and in random ways.
As was the case in the 2018 analysis, this research design is biased to under-estimate the effect of billboards on turnout. The design relies on an intent-to-treat (ITT) strategy because actual exposure is unknowable. Exposure/compliance in the treatment cells is less than 100% (not everyone in the cell actually sees the billboard) and exposure/compliance to the treatment in the control cells is greater than 0% (people who live in the control cells may still see a treatment billboard in a nearby treatment cell). This situation makes it virtually impossible to over-estimate (and very likely to under-estimate) the effect of the mobilization billboards by reducing the likely difference between the groups: treatment cells do not capture the full effect (if there is one) and control cells may show an effect from exposure to treatment outside the cell.

Table 2 above describes four characteristics for each of the research areas across treatment and control fishnet cells: number of fishnet cells, number of billboards, total registered voters, and average registered voters per cell. The number of cells analyzed for Mississippi reflects a reduction from the original amount. Following an error by the billboard vendor, NCO was provided with compensatory billboards – that did not conform to the random assignment strategy – throughout the Jackson, MS metropolitan area. This forced the elimination of the Jackson region from the analysis. The consequences of this are discussed below.
Models and Voter Propensity
To test the effect of the billboards we compare individual-level voter turnout in treatment cells and control cells. For the Virginia, Mississippi, and Kentucky elections, turnout is measured as whether a person voted in the 2019 general election. Louisiana does not have a traditional primary-general system, rather it has a two-stage general-primary with all candidates and a general-runoff if no candidate receives 50% in the general-primary. The models presented here use the first of those two elections.4 The effect is estimated using logit regression models that control for voter propensity.
Voter propensity is modeled separately as a function of prior election turnout, sex, race, age, Census block group median income, Census block group race (percent white), and Census tract population density. Table 3 compares the voter propensity across the treatment and control groups for each of the research areas. The differences in average voter propensity across treatment and control groups are very small, ranging from .001 to .009, indicating that the random selection produced groups of fishnet cells that are, on the whole, very similar.

Results
The first set of results (Figure 3) presents the effect of the billboard treatment on the probability of individual-level turnout. (Complete results for all models can be found in the appendix.) Each bar represents the change in the probability of turnout as a result of residing in a fishnet cell with at least one treatment billboard as compared to residing in a fishnet cell with at least one control billboard. The whisker on each bar indicates the 95 percent confidence interval for the effect.5 We run analyses for the research sites combined together and individually.

When the four sites are combined, the billboard treatment increases the probability of a person voting by 1.6 percentage points. To put this in context, the average person in one of our control cells had a probability of turning out in 2019 of 12.1% compared to a probability of 13.7% in one of our treatment cells. This increase is similar to other voter mobilization effects in these types of odd year elections. When we look at the results on a state-by-state basis, we find the effect for Mississippi is negative and significant at the 95% level. It is highly unlikely that non-partisan billboards that encourage turnout are actually suppressing it. While it is difficult to be confident about what is causing this negative result, it could be the result of the situation leading to the elimination of the Jackson area from the analysis (discussed above). Because of this possibility, we also estimate the combined effect of the billboards excluding Mississippi and find that they produce a 1.8 percentage point increase in the probability of turning out. Among the three other areas, Louisiana had the largest effect (2.5 percentage points) and Kentucky had the weakest effect (0.7 percentage points).
One of the primary findings of the previous NCO billboard study (and many other mobilization studies) was that the effect of billboards was most present among mid-propensity voters (voters that are neither very unlikely nor very likely to vote). This is theoretically sensible given the passive nature of billboards; they likely serve as a reminder for those who need reminding, not a stimulus to vote among those who were unmotivated to do so in the first place. We find the same thing in this analysis: the effect of being in a treatment cell is largest amongst mid-propensity voters (those whose probability of voting was between about 30% and 70%). This is displayed in Figure 4 which shows the effect of the treatment over the full range of individual voting propensity for Louisiana, Virginia, Kentucky, and those three areas combined.

The study also had two unexpected findings. The first is that the effect for dosage (number of billboards in a fishnet cell) is either statistically insignificant or negative (such that increased dosage leads to lower turnout). The second is that effect for billboard proximity is either statistically insignificant or positive (such that being farther away from a billboard leads to higher turnout). Note that these results do not indicate that more billboards or closer proximity makes the overall effect negative, just that among treated cells there is no difference between or slightly lower turnout in the higher dosage cells and for individuals living closer to billboards. The experiment was not designed to make confident inferences about either dosage or distance. Neither variable was randomly assigned because we have no control over billboard locations or where people live. The variables are also related to one another (correlated at r=0.25) as more billboards reduces the distance to the closest billboards so it is not surprising that these variables yield unexpected results simultaneously.
The strongest predictors of both dosage and proximity to a billboard are variables that are associated with very low voter turnout (high block-group level unemployment, high poverty and low block-group level marriage). Thus, the population with higher dosage and closer proximity has a lower likelihood of being motivated to vote, so the reminder mechanism of a billboard may not be as effective. It may simply be that even with our randomization and controls for voter propensity, the low motivation to turnout in high dosage cells is not fully accounted for in the statistical model. One piece of evidence for this theory is that when the analysis is restricted only to cells that contain one billboard (59 of the 106 non-Mississippi cells), the effect of a billboard weakens for people living farther from the billboard. Figure 5 shows this expected effect of proximity for Louisiana and the combined model (excluding Mississippi). In a cell where there is only one billboard, people who live closer to a billboard are more likely to turnout than people who live farther from a billboard.

Cost Per Net Additional Vote
A cost analysis is presented in Table 4. When the Louisiana, Virginia, and Kentucky sites are combined, we find that the cost per net additional vote in the treatment cell was $23.64. However, these numbers should be read with caution. This cost analysis assumes that the effect of the billboard is fully constrained to the fishnet cell. This is almost certainly not the true extent of the effect. If, for example, half of the people that voted as a result of a billboard reside outside the treatment cell (a conservative estimate given that billboards tend to be located in more non-residential areas), then the cost per net additional vote presented here is double what it is in actuality. Additionally, the experiment was designed to make a conservative estimate of the effect of billboards on turnout (even within the fishnet cell). If true effects are actually larger than what we estimate, then the cost per net additional vote is also lower than what we estimate.

Conclusion and Opportunities for Future Research
This study should be understood as but one test of the effect of billboards on voter turnout. Nevertheless, the evidence presented points to billboards having a positive impact on voter turnout, particularly among mid-propensity voters. These findings are consistent with the results of the 2018 non-experimental analysis. The results and the nature of billboards as a voter mobilization tool, also suggest the need for caution. We emphasize that caution on three accounts, in particular:
- The way in which billboards are observed makes the determination of a precise effect, and thus the cost per net additional vote, difficult.
- The results for Mississippi, which ran counter to expectation, emphasize the need to avoid over- generalizing the findings. That result may be a function of the elimination of Jackson from the research areas, an outlier randomization, or an indication that billboards are not as effective as the rest of the study indicates.
- The study raised some questions about how billboard dosage (the number of billboards in a given space) functions. Understanding dosage is important because it can allow for a more efficient purchasing strategy – one that minimizes cost and maximizes effectiveness.
There are certainly opportunities to develop alternative research designs that could yield more insight into billboard effectiveness and optimal purchasing and placement strategy. For example, different approaches to boundary randomization could be considered. The use of 3-mile by 3-mile fishnet cells makes a consistent distance-based assumption about the effect of billboards. Of course, billboard effects are not actually constrained by these imposed boundaries and this may have substantially blurred the difference between control and treatment areas in this study. One alternative is to vary the size of the fishnet cells either within or across research sites. Another is to utilize a strategy where treatment areas and control areas are in different parts of a state so as to substantially reduce the amount of treatment exposure to those in the control group.