2017 Virginia billboard campaign analysis

Increasing Voter Turnout: An Investigation of the Efficacy of Billboard and Street Advertisements in the 2017 Virginia Gubernatorial Election
Program design by Debra Cleaver (VoteAmerica), program analysis by Molly Graepel (Grad student Harvard University). Professor Janina Matuszeski Professor Matthew Baum (Harvard University) served as faculty advisors. Additional evaluation support by Amelia Showalter, Chief Executive Officer & Co-Founder, Pantheon Analytics. This evaluation was originally published on March 7, 2018.
EXECUTIVE SUMMARY
Research Question
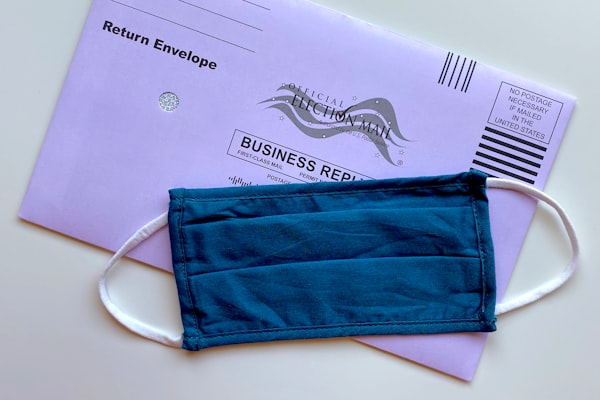
Voter turnout in the United States is notoriously low – only 56 percent of the voting-age population cast ballots in the 2016 presidential election, putting the US behind most developed democratic countries. VOTE.org, a nonpartisan 501(c)3 nonprofit working to increase voter turnout and reduce barriers to voting in the United States, purchased ninety-three advertisement placements on billboards and pieces of street furniture in the Tidewater region of Virginia prior to the gubernatorial election of 2017 to remind residents to vote on Election Day. This exercise examines the impact of these billboards and pieces of street furniture on increasing voter turnout in the Tidewater region, and seeks to recommend if VOTE.org should utilize these channels in future elections.
Methodology
The analysis observed if precincts with a higher exposure to billboards had increased levels of turnout. This involved running ordinary least squares (OLS) regressions to identify an effect of billboards on voter turnout as a percent of registered voters at the precinct-level. A treatment variable was constructed by calculating billboard density for each precinct.
Key Finding & Recommendations
No detectable impact on turnout from billboards and street furniture was found, suggesting they are unlikely to boost turnout on average at the precinct-level. However, detecting the effect of any mass media appeal is a challenging undertaking as it, by nature, reaches people indiscriminately. Other factors should also be considered when determining if billboards and street furniture should be utilized in upcoming elections. It is recommend that NCO:
- Continue to purchase billboards and street furniture with GOTV messaging as they have a low cost-per-exposure compared to other communication channels.
- Shorten the time frame of billboard placements -- psychology research has shown that attention to print advertisements decreases with increased exposure. Ideally, attention to the billboards and street furniture would be highest closer to Election Day.
- Replicate and improve this analysis by conducting the experiment at an individual-level through voter file analysis during another election to better identify the causal effects of billboards and street furniture on turnout.
SECTION 1: INTRODUCTION
Problem Statement & Research Question
Voter turnout in the United States is notoriously low – only 56 percent of the voting-age population cast ballots in the 2016 presidential election, putting the US behind most developed democratic countries (DeSilver). Starting in the 1970s, voter turnout for presidential elections has only slightly exceeded half of the voting-age population; this number is lower for midterm elections, with about 40 percent of the voting-age population turning out to vote over the last forty years. Participation has been even lower for odd years, primary and local elections (FairVote.org). (Five states elect their respective governors during off-year elections: Kentucky, Louisiana, Mississippi, New Jersey and Virginia.)
The vast literature on voter turnout in the United States points to a broad range of explanations for the low participation rate. Many academics and researchers attribute low turnout to larger institutional causes such as failing civic education and the lack of a proportional representation system in the United States (Rosenstone & Hansen 27).
Alternatively, the “civic voluntarism model” posits that one cause of low turnout is that many people do not know when to vote. At the very minimum, citizens must know that a voting opportunity exists to participate in an election. Therefore, contacting voters and providing them with information such as polling location or election date (known as “getting out the vote”), increases the likelihood that individuals will become aware of this voting opportunity and act upon it (Verba, Sidney, et al. 272-275).
The civic voluntarism model is supported by field experiments that demonstrate the effects of both personal and impersonal get out the vote (GOTV) efforts on the likelihood of voting.

Campaigns, lobbying groups, and nonpartisan organizations seeking to increase turnout utilize these methods to mobilize voters. As seen above, the cost-effectiveness varies by GOTV activity, and due to limited funding, these organizations must make decisions about which channels and tactics to use to optimize their electoral strategy. While statistically reliable effects have been demonstrated for the above GOTV activities, little evidence exists on the causal impact of mass media GOTV appeals; isolating and detecting the effect of untargeted messaging is much more difficult than direct GOTV efforts. This policy analysis exercise will look specifically at the GOTV impact of billboards, which only one other publicly-available study has examined, and attempt to determine if it is an effective channel for increasing voter turnout. (The other publicly available study is: Panagopoulos, Costas, and Shang E. Ha. “Billboards and Turnout: A Randomized Field Experiment.” Journal of Political Marketing, vol. 14, no. 4, 2015, pp. 391–404.)
Hypotheses
In theory, get out the vote messages delivered via mass media channels such as billboards have the capacity to activate an individual’s sense of civic duty, and we would expect positive effects on turnout. The noticeable reminder theory, created by AllisonDale and Aaron Strauss, suggests that voters will be responsive even to impersonal communications that merely remind them to vote in an upcoming election as they are simply difficult to ignore (Dale & Strauss 790).
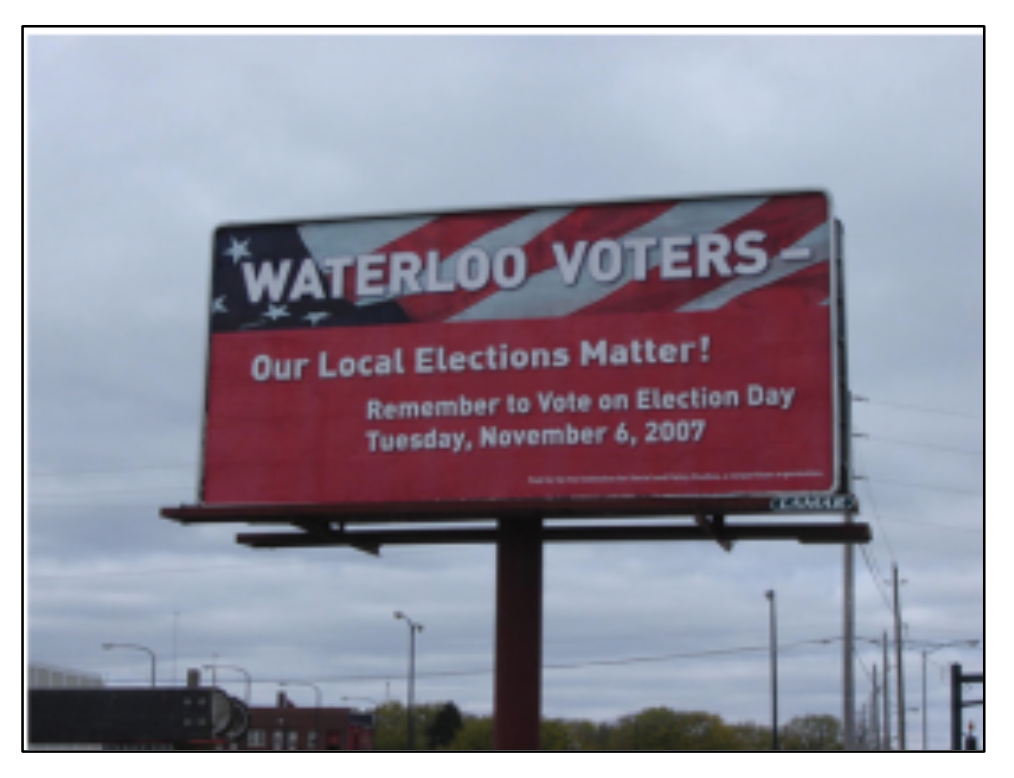
However, a wide range of field experimental studies show that messages delivered through mass media, such as television and radio, are ineffective (Green & Gerber 158). Despite billboard advertising being commonly used by political campaigns for persuasion (example: “Vote for Candidate Smith”), only one study exists which tests the causal effects of billboard advertising on voter turnout. Costas Panagopoulos and Shang E. Ha found that billboards with the message “WATERLOO VOTERS – Our Elections Matter! Remember to Vote on Election Day. Tuesday, November 6th, 2007” were ineffective in generating higher levels of voter turnout during local elections in November of 2007 (Panagopoulos & Ha 2).
However, in another randomized, mass media field experiment, Panagopoulos demonstrated the effectiveness of street signs with the message “VOTE TOMORROW.” During the 2005 municipal elections in New York City, Panagopoulos found that street signs held by volunteers at high-traffic intersections on Election Day had a positive effect on turnout. Though street signs held by volunteers are different in design from billboards, both are “impersonal” means of messaging a voter, and may have similar effects (Panagopoulos 1&2).
These two studies offer competing hypotheses about the likely impact of billboard appeals. This analysis attempts to build on or disprove the research by looking at a larger, high-salience election.
Billboard Treatment used in Panagopoulos & Shang E. Ha Study
SECTION 2: BACKGROUND
About NCO
Nation Civic Organization (NCO) is a nonpartisan 501(c)3 nonprofit working to increase voter turnout and reduce barriers to voting in the United States. The nonprofit primarily seeks to increase voter turnout and registration through mass SMS texting and website technology. SMS messaging, in particular, has become a mainstream electoral organizing tactic with modest, but cost-effective mobilization effects. NCO used the period leading up to the 2017 Virginia gubernatorial race to complement their SMS texting efforts and experiment with more traditional and often overlooked platforms. In September and October of 2017, NCO purchased ninety-three advertisement placements on billboards and pieces of street furniture in Virginia prior to the gubernatorial election. Additionally, ninety-seven exterior bus advertising placements were purchased with the Hampton Roads Transit, the regional public bus with a 369-square-mile service area around Hampton Roads in southeastern Virginia.
Billboard and Street Furniture Placement
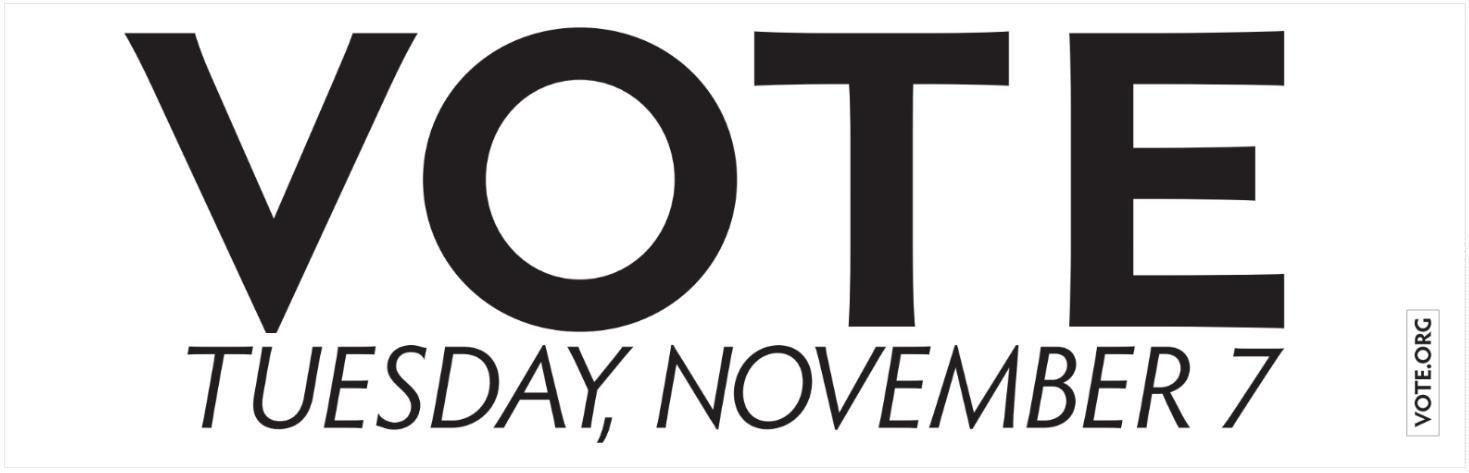
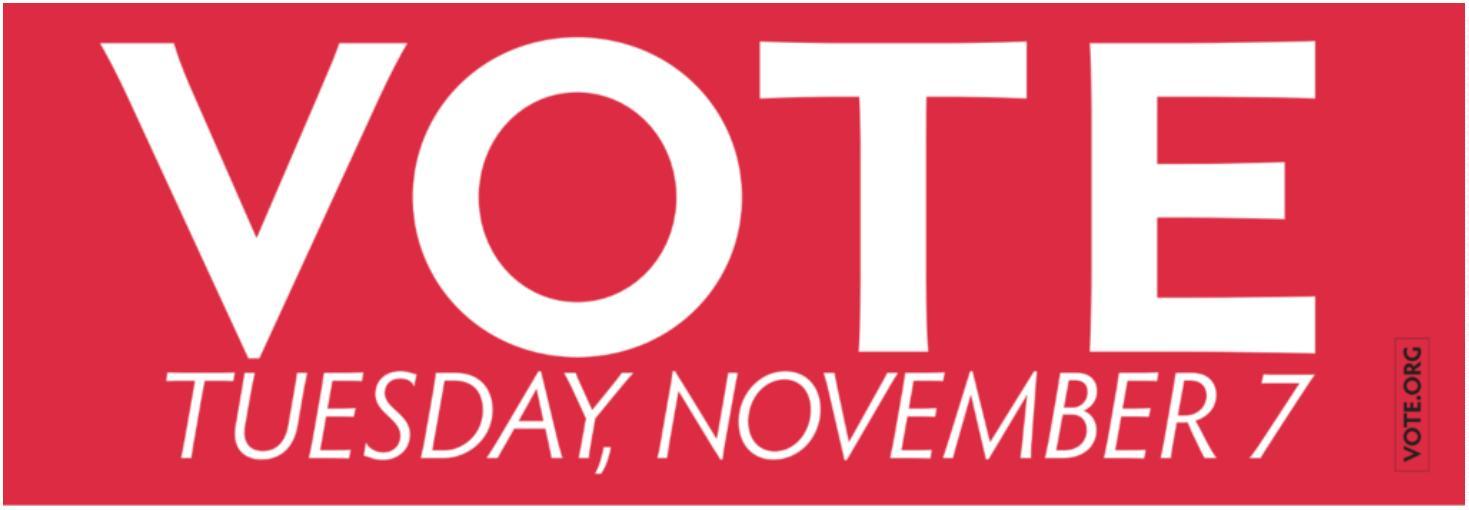
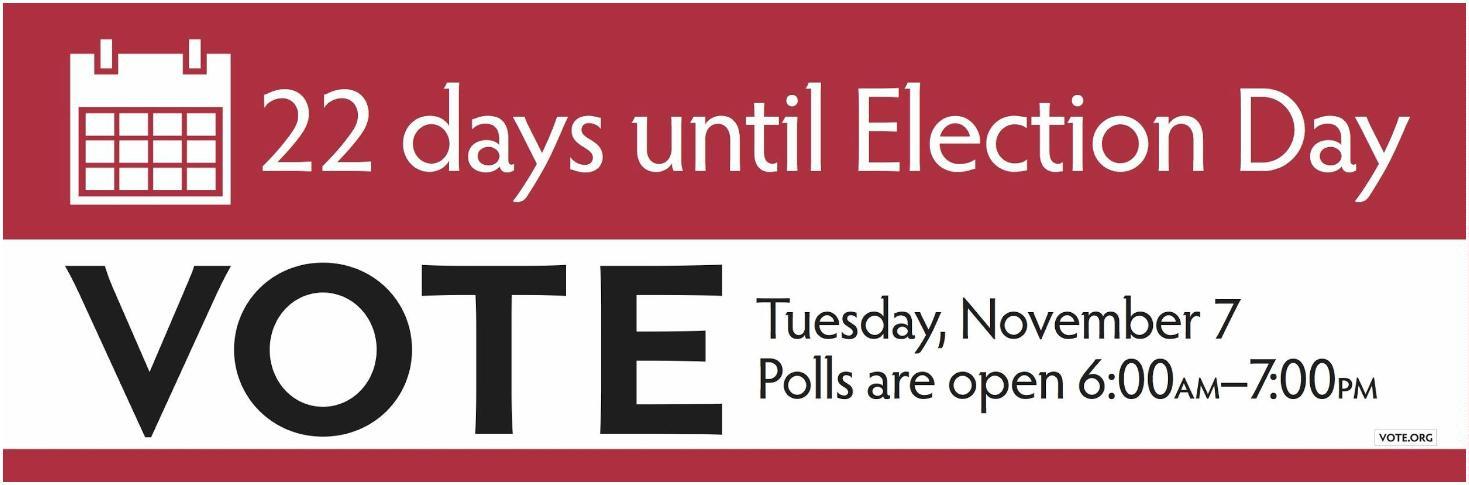
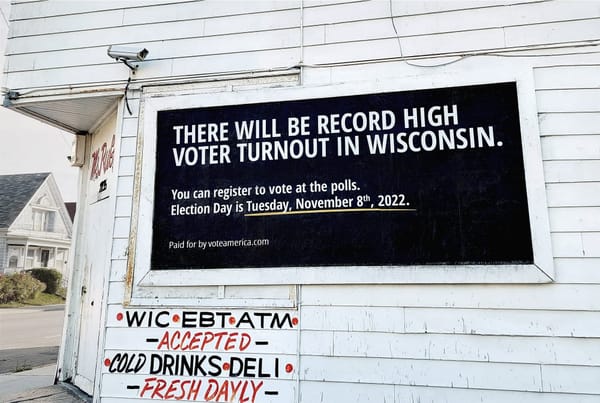
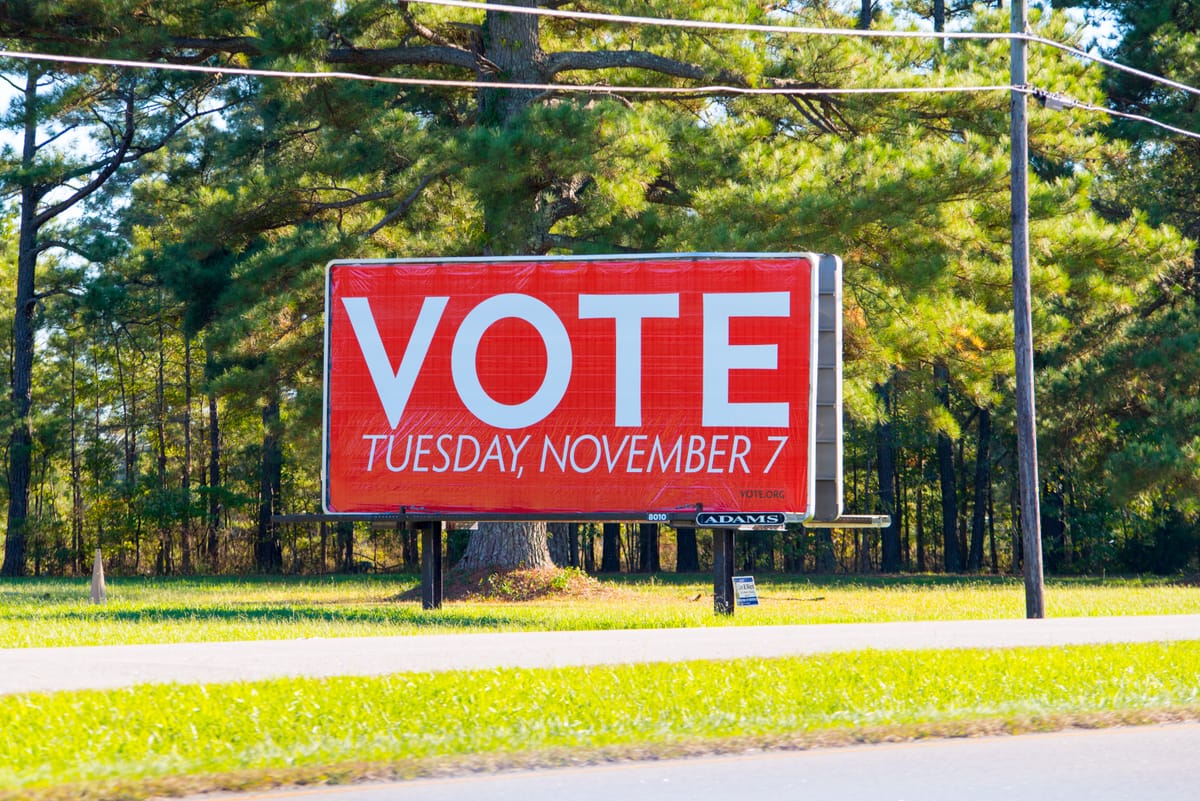
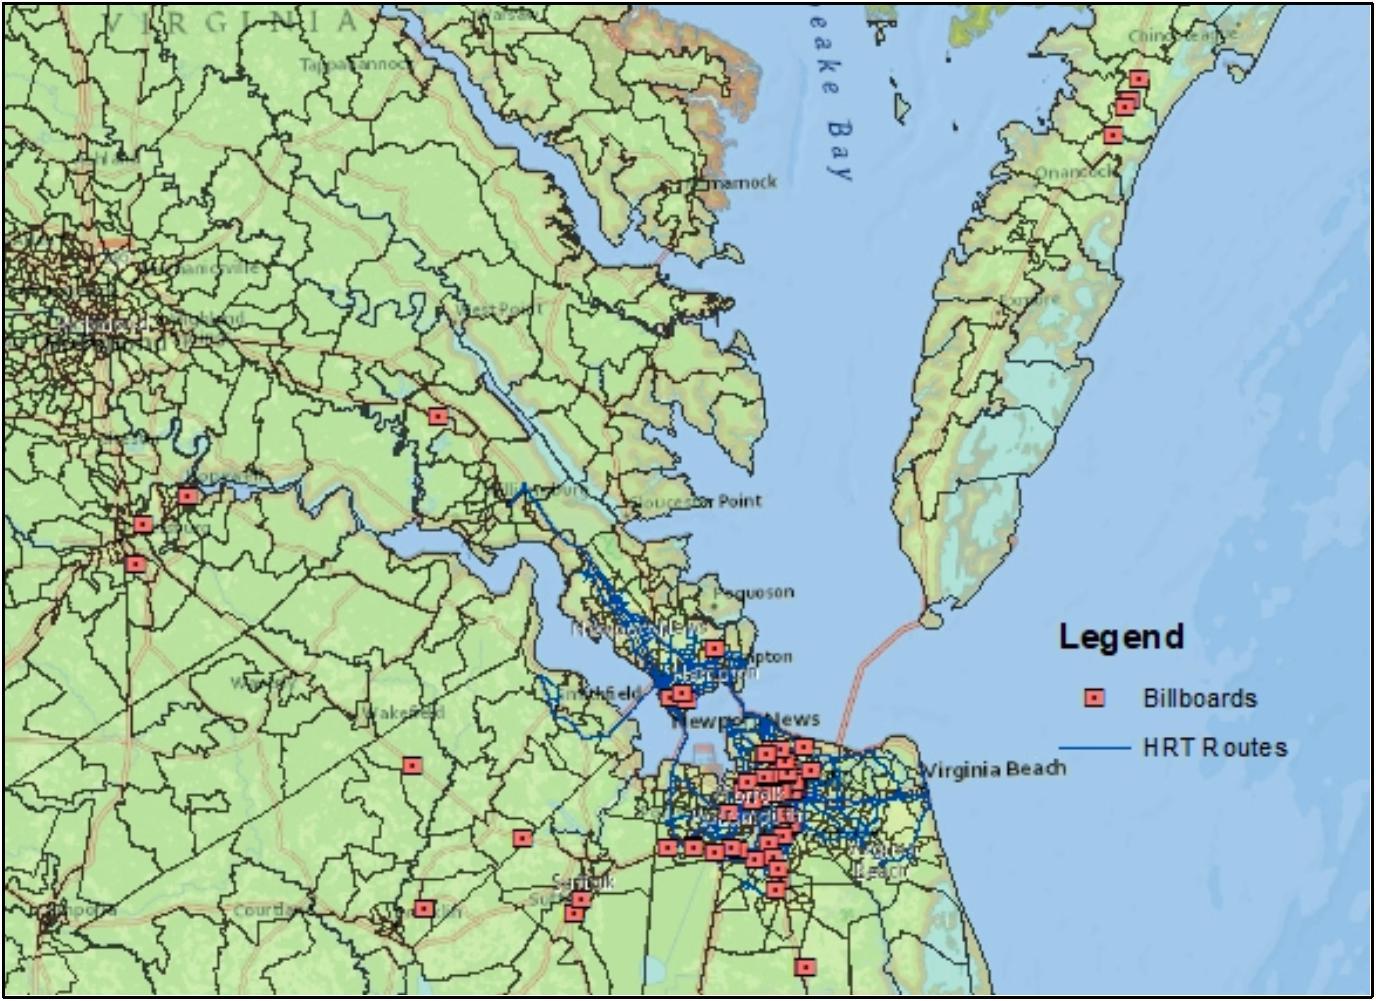
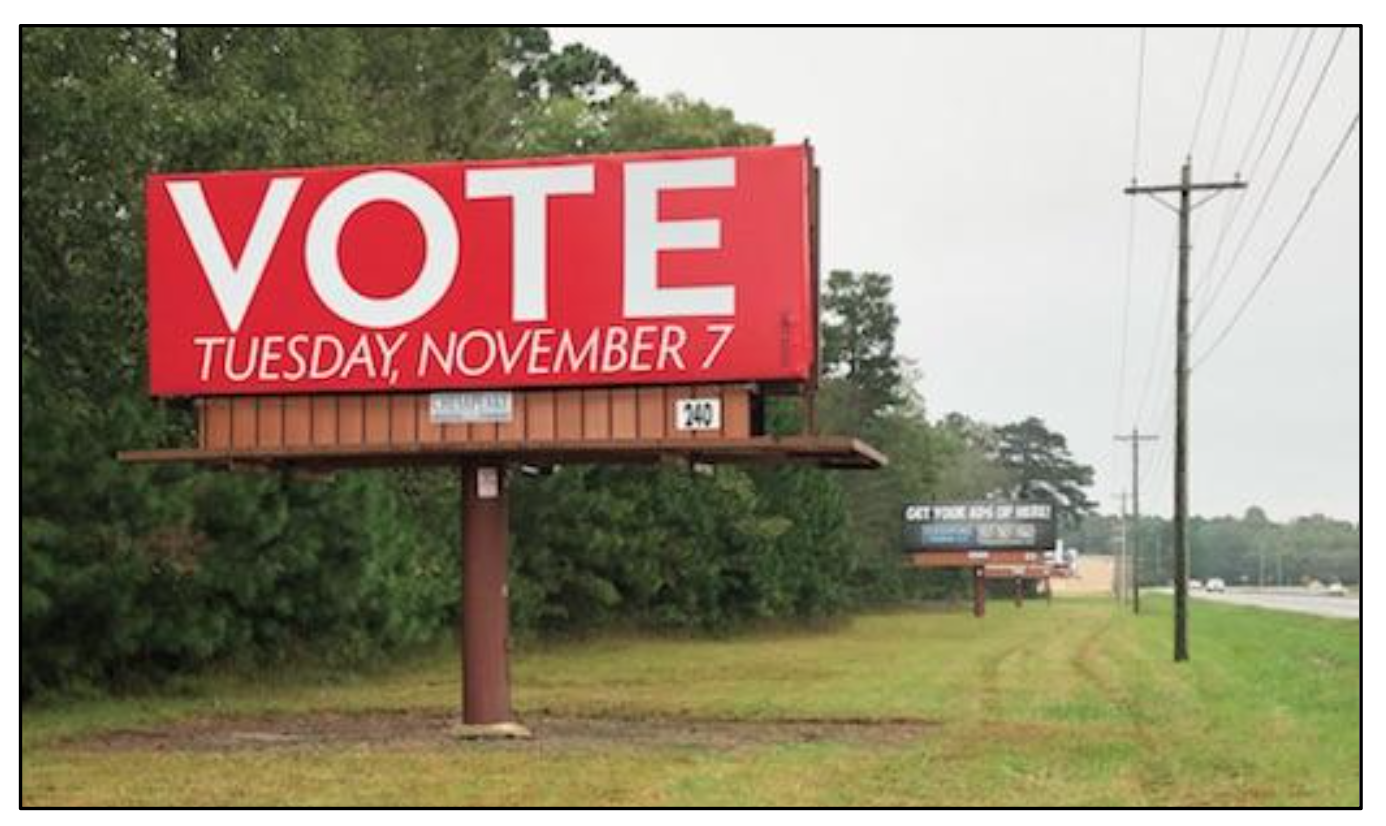
Advertisement space was purchased for thirty-five street furniture advertisements (smaller visual displays of 5'3" x 9'3" placed at bus stops) and fifty-eight billboards (forty-eight static and ten digital) starting in late September and mid-October in fourteen different Virginia counties within the Tidewater Region of southeastern Virginia. All pieces contained the message “VOTE Tuesday November 7” in large font. Digital billboards included a countdown for the number of days remaining until election day, as well as election-day polling hours. Eighty-three of the billboards were red and white, while ten were white and black.
Billboard Placement And Bus Routes
Highway billboard with NCO advertisement
2017 Virginia Election
Statewide and municipal elections were held in Virginia November 7, 2017. The main election being held in Virginia was the state's gubernatorial election. In addition, all of Virginia's House of Delegates seats were up for re-election. Virginia’s gubernatorial race is one of the first big statewide races held after a presidential election, and is often a nationalized race that serves as a ballot on the president’s performance. Turnout in 2017 was the highest in 20 years for a gubernatorial race, five percentage points and eight percentage points higher than the last two.
SECTION 3:. MEASURING BILLBOARD EFFICACY: METHODOLOGY & FINDINGS
Sources of Information
In order to properly observe the effects of billboards on turnout in the 2017 race, two master dataset were compiled: a precinct-level dataset and a billboard-level dataset. The data were cleaned, coded, and merged from six public and private data sources to create two original datasets with 93 observations for each billboard and 753 observations for each precinct across five years.
Note on dropped data: Precinct boundaries can be redrawn, merged, or divided over time. This created problems as aggregated historical vote and demographic data at the precinct-level were utilized in the analysis. As a result, sixteen precincts were dropped that were in the specified range of distances from a billboard: 071 Round Hill, 073 Dahia , 097 India River, 098 Independence, 003 Ocean Lake, 096 Hilltop, 095 Dam Neck, 096 Beach, 215 North Bird, 203 Bird, 318 West Beach, 101 Berkeley A, 101 Berkeley D, 214 Richmond, Richmond 206, 067 Eastern Shore.

Variables
Response Variable
The response variable used was total votes per precinct divided by registration count as of November 2017. All votes were included in the numerator: those for the two major party candidates, independents, and write-ins. Because of the reporting practices of the Virginia Secretary of State, absentee votes were not included in the vote total for the response variable. Absentee votes are not included in precinct-level reporting, but rather aggregated at the county level and reported as a “central absentee voter precincts” for each individual county. Because the billboard advertisements instructed residents to vote on November 7th, and not to apply to vote through absentee ballot, removal of these votes from the calculation was justifiable. It is worth noting that absentee voting has never been as popular in Virginia as in other states, and 2017 saw no surge in absentee votes compared to past elections. According to the Virginia Department of Elections website, only 6 percent of the 2017 vote came from absentee voters (and 5 percent in 2013)
NOTE: Virginia restricts absentee votes to only those with a valid excuse from a very specific list. Valid excuses for absentee are: student attending college or university outside of locality of residence in Virginia, spouse of student attending college or university outside locality of residence in Virginia, business outside County/City of residence on Election Day, personal business or vacation outside County/City of residence on Election Day, working and commuting to/from home for 11 or more hours between 6:00 AM and 7:00 PM on Election Day, first responder, disability or illness, responsible for the care of a disabled/ill family member confined at home, pregnancy, awaiting trial, an electoral board member, registrar, officer of election, or custodian of voting equipment, obligation, Active Duty Merchant Marine or Armed Forces, spouse or dependent living with a member of 6A, temporarily residing outside of US, temporarily residing outside of US for employment or spouse or dependent residing with employee
Treatment Variables
The treatment, or the effect of the billboards on voter turnout, was measured with a “dosage calculation” as to understand if a stronger dosage of billboards had an increased effect on turnout. A stronger dosage implies a higher density of billboards within or surrounding a precinct. The dosage was constructed by applying Geographical information systems (GIS) to measure distances from precincts to the billboards.
Distance measures were calculated from the population-weighted centroid of each precinct to the given latitude-longitude coordinate of the billboard. Population weights were generated from 2010 census data by performing spatial joins on census blocks to precincts. Note: A census block is the smallest geographic unit used by the United States Census Bureau. Population was not distributed across the census block - the centroid of the census block was used for to represent the population location of the given census block.
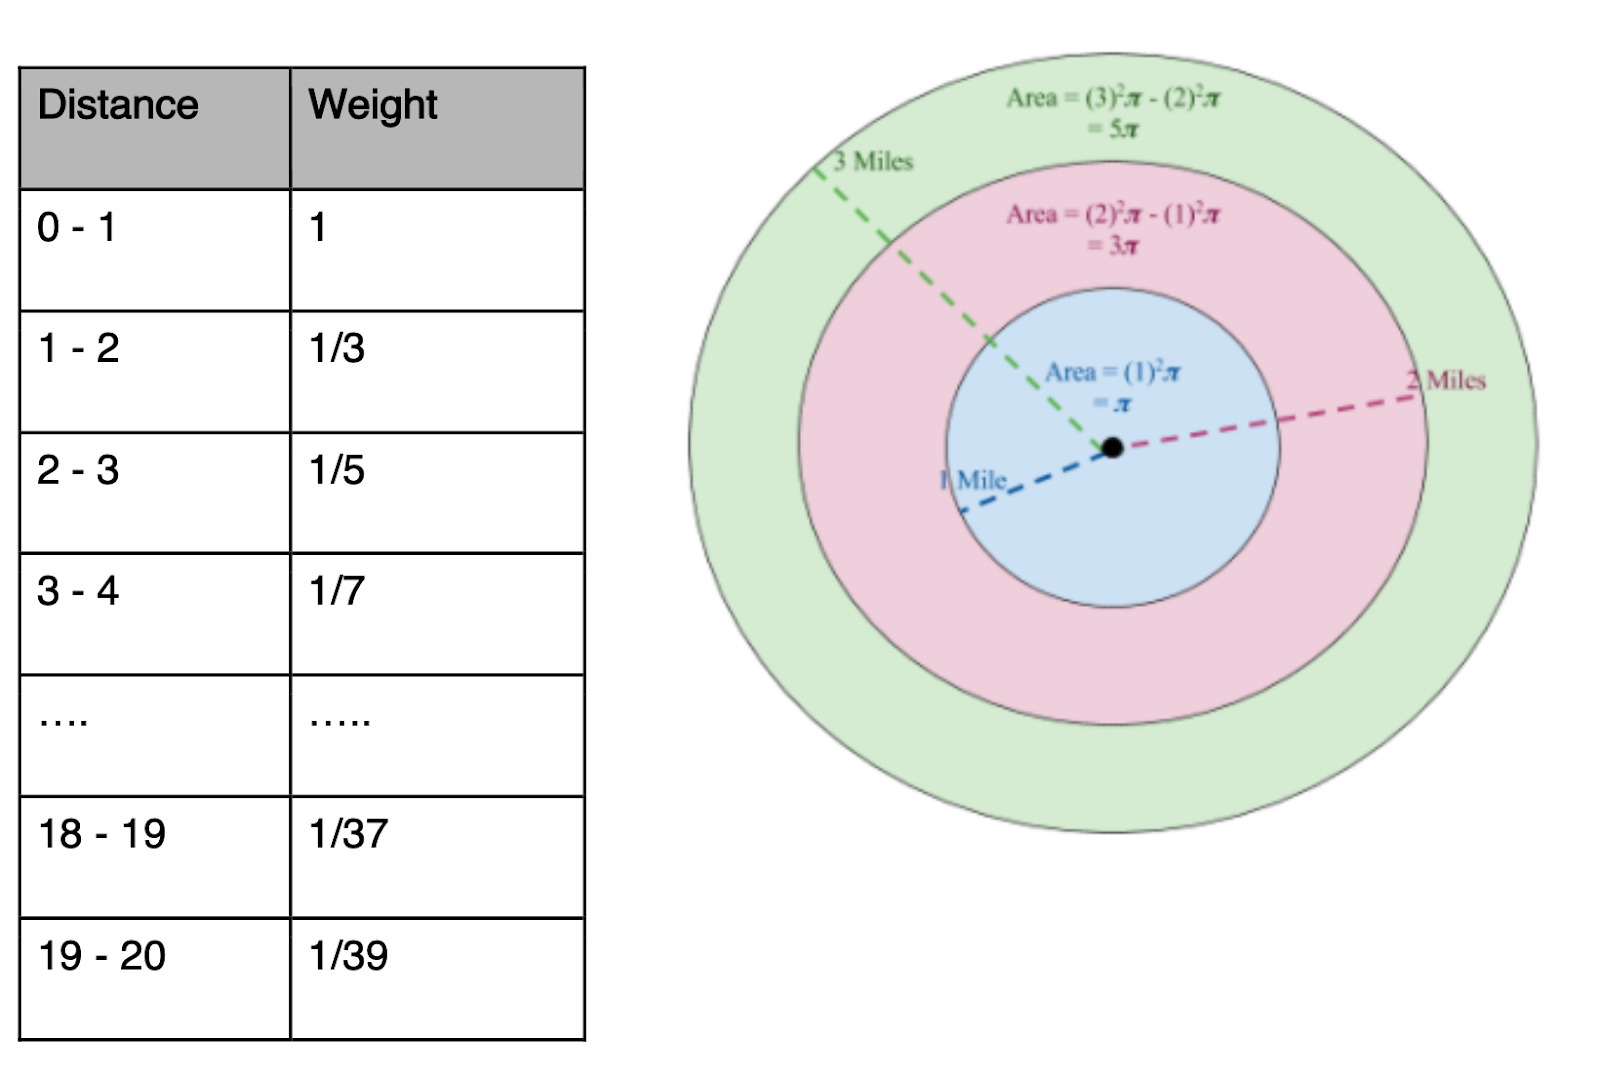
Precincts within twenty miles of billboards were included in the analysis. According to census data from 2010, average and median commute time of residents in Tidewater counties were both twenty-seven minutes -- these data points were used to select the twenty-mile cutoff. Twenty bucket variables at the mile level were then created to measure the “dosage” of the billboard treatment (eg. dosage from 0 to 1 miles, 1 to 2 miles, 2 to 3 miles...., 18 to 19 miles, 19 to 20 miles).
Two types of dosage variables were used in the analysis: one that factored in aggregate estimated impressions of billboards and one that relied solely on count of billboards within a certain distance. Both of these were exclusive counts, for example, aggregated impressions within 0 - 1 miles of a billboard were not included in the bucket for aggregated impressions within 1 - 2 miles of a billboard.
- Count: Billboard counts were calculated by adding up the number of billboards and street furniture pieces within a certain distance bucket from a precinct centroid.
- Impressions through Model-based Imputation: Impressions provide greater detail than simple counts as the audience size of any given billboard will vary based on geographical placement. Estimates of impressions per billboard over a four-week period were provided by AdQuick, a self-service platform utilized by NCO to buy and measure outdoor advertising. The billboards and street furniture are not owned by AdQuick, but rather various media vendors. Three different vendors supplied the billboards purchased by NCO – two of these vendors provided impressions, however one did not. Therefore, a linear model-based imputation strategy was utilized to fill in missing impression data. Type (static vs. digital), size, location, and price (normalized on a scale from 0 to 1) of billboards without missing impression data were used to build a simple linear regression model to predict the impressions for billboards with missing data. Data was trained on fifty-two observations and predicted forty one observations, with a testing R-squared of 0.63.
Due to both the imputation and unknown methodology that the vendors used to determine impression estimates, both count and impressions were used in the analyses in separate regressions to ensure that results were not divergent, even though impressions – in theory – should better explain treatment effects.
Billboard density was also used in the construction of the dosage variables. The number of impressions and counts in higher distance buckets were proportionally reduced to account for the diluted effect of lower billboard/impression density. A weighting was applied to downweight billboards farther away based on area covered – each distance bucket was weighted by the proportion of area covered in the bucket compared to the area covered between 0 and 1 miles.
Covariates
A number of covariates were included in the analysis to absorb variation that is unrelated to the billboards. Factors that are common in explaining turnout, including past registration, past turnout, education level, income, and racial makeup of registered voters, were included in the base model as “basic covariates.” These covariates were identified by interviewing several experts in the field of political analytics. (Interviews conducted with David Nickerson, Associate Professor in the Department of Political Science, and Meg Schwenzfeier, Harvard PhD program in Government.
Basic Covariates:
- 2016 Total Votes / Registered Voters and 2013 Total Votes / Registered Voters: These variables are calculated in the same way the response variable for 2017 was calculated, with absentee vote counts excluded.
- 2016 Demographics: Over thirty variables were included on detailed demographics information on education, race, and income at the precinct level from TargetSmart.
Additional Covariates:
- Percent of registered voters in the military: The US Armed Forces have several major military centers in Virginia. People living on military compounds may be less likely to travel extended distances because they live and work within the same region and military bases often act as self-serving communities.
- Percent of registered voters with cars: Residents from areas with lower concentrations of car owners will likely have less exposure to highway billboards.
- Percent of registered voters under the age of 29: This variable is used as an indication of precincts overlapping with college communities, which tend to have different turnout behavior.
- Bus route count: As mentioned earlier, NCO purchased ninety-seven exterior bus advertisements. At the start of this analysis, the effect of the bus ad was intended to be measured under the assumption that all 280 Hampton Road Transit (HRT) buses that spread across the Hampton Road region would display the NCO ad. Bus route GIS-data and schedules were obtained from the HRT data department to measure exposure to bus ads. It was later learned that less than one-third of the buses had the NCO ad. HRT is not able to commit an advertisement to any specific bus route, nor are they able to identify where an ad is shown. As a result, it is impossible to measure the exposure to bus ads. However, a bus route count variable, which quantifies the number of times a bus route intersects with a precinct, was included to control for any possible effect resulting from bus advertisements.
Regressions
Base Model
Approximately 30 different covariates from TargetSmart were tested and run through a cross-validated lasso regression to avoid multicollinearity. Observations were split into training (75 percent) and test (25 percent), with a best alpha parameter of 0.00001, training R-Squared score of 0.905, and test score of 0.914. Percent caucasian registered voters (RVs), percent of RVs with income less than $60,000 and percent of RVs with less than college degree were the most important covariates.
After reducing dimensionality in demographic data through a lasso regression, additional covariates (age, military, car ownership, and HRT bus route intersections) were appended to the model. Only age came back with significance, as seen in the table below.


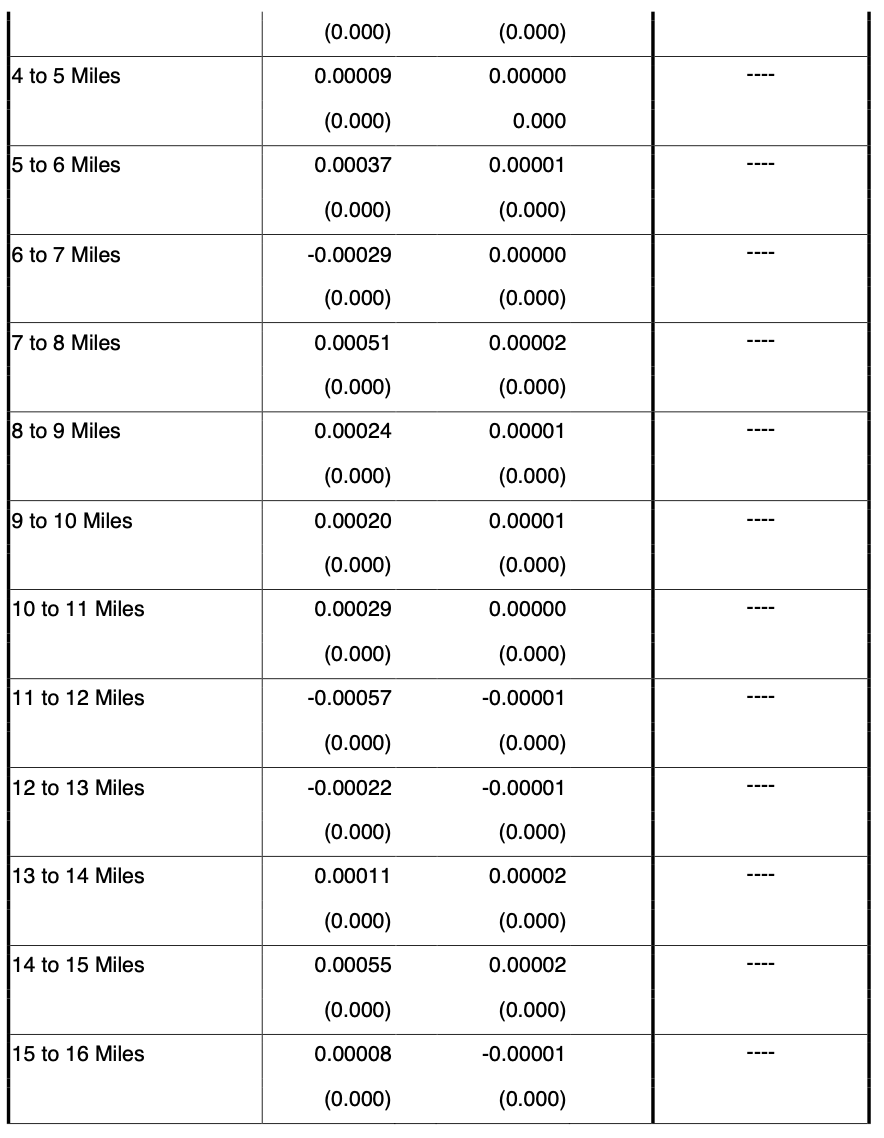
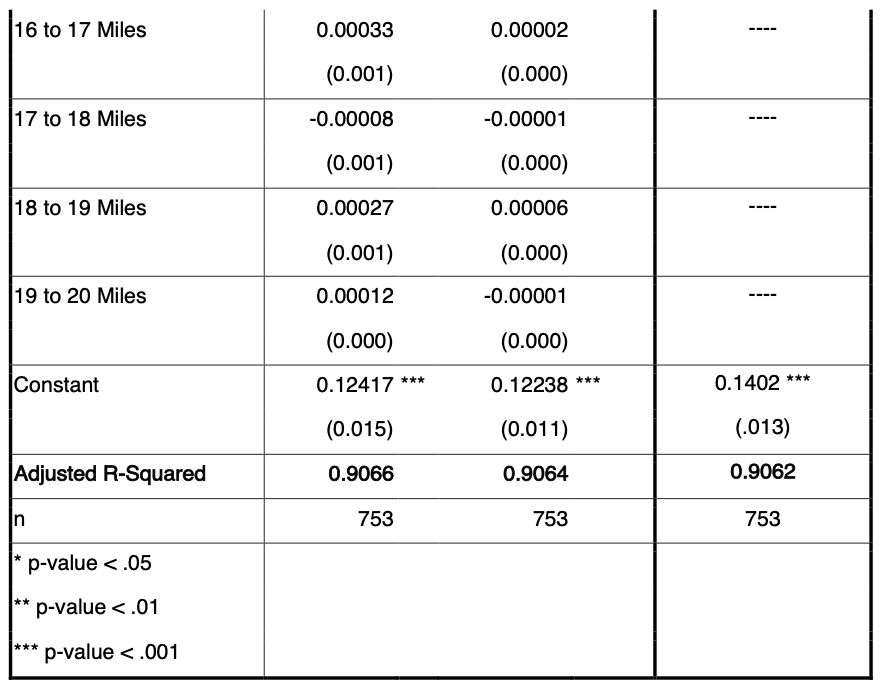
Regressions with Billboard Treatment
Using the base model with the added covariate of percent of registered voters between the age 18 and 29, the weighted billboard dosage variables were added. Two regressions were run, one with the impressions dosage and one with the count. Additionally, a third model was run that combines all 20 of the weighted buckets for impressions using one composite variable. All billboard treatment dosages came back statistically insignificant for each regressions – the analyses demonstrated no impact on turnout from billboards, suggesting they are unlikely to boost turnout on average at the precinct level.

SECTION 4: RECOMMENDATIONS
The previous section concluded that the billboards and street furniture placed in the Virginia Tidewater region had no detectable effect on voter turnout. This section aims to suggest practical strategy options for NCO moving forward based on those findings. Despite the null results from this analysis, there are still important lessons that can be drawn to inform NCO’s strategy for utilizing billboards in upcoming elections, and as a result, the three following actions are recommended:
(1) Continue to purchase billboards and street furniture with GOTV messaging
As stated earlier in this paper, the impact of billboards on voter turnout is still a Much-unexplored field. Measuring the causal effect of any mass media appeal is a challenging undertaking as it, by nature, reaches people indiscriminately. The analysis is also complicated by the fact that the Virginia gubernatorial race received a large amount of national attention, and many organizations other than NCO implemented GOTV efforts. With all the noise surrounding this particular election, it is not surprising that a single program’s marginal impact was difficult to detect. With these two limitations in mind, it is not safe to completely rule out the possibility that the effect of the billboards on voter turnout is non-zero, and therefore, I recommend continued investment in utilizing with billboard and street furniture for upcoming elections.
This recommendation is supported by the low cost-per-exposure of billboards. Relative to other media, billboard and street furniture advertising have the ability to reach wide audiences at low production costs. The average CPM (cost-per–thousand advertisement impressions) of the billboards purchased by NCO was $6.72, compared to $19.82 for on broadcast TV and $10.51 on magazines and magazines (Media Dynamics 1). Additionally, studies in the fields of marketing and advertising found that unaided recall of messages advertised using outdoor media exceeds recall of messages encountered on network or cable television (Cunningham & Coleman 29).
With prior evidence for effectiveness in memory recall, along with the general cost effectiveness of billboards, I recommend continued use of billboards and street furniture despite the Low-magnitude/undetectable effects found in this analysis.
(2) Shorten the Time Frame of Billboard Placements
Marketing research on attention demonstrates the majority of ads on billboards receive at most a single eye fixation for each exposure, but only 100 milliseconds are needed for a consumer to identify the message of the advertisement with high accuracy (Pieters 428). This research implies that a person would only need to see NCO’s GOTV message once to absorb the relevant message that there is an election occurring on Tuesday, November 7th. However, other marketing research demonstrates that repeated exposure to print advertisements significantly reduces a person’s attention to the advertisement – by the third exposure, people pay 50 percent less attention that they did the first exposure (Sacharin 572 & 573). The NCO billboards and street furniture GOTV advertisements examined in this analysis were shown from forty-three to fifty-five days prior to Election Day. People with commute paths that intersected with these advertisements may have been exposed to the advertisements well over thirty times. When Election Day approaches, they may not even notice the advertisement due to overexposure. Ideally, attention to the NCO ads would be highest the day of or day before the election.
GOTV research has shown that television ads aired during the final two weeks of the campaign were more effective at increasing turnout than ads shown earlier in the cycle (Sides & Karuch 474). In another experiment, direct mail was distributed eight days or four days prior to Election Day in 2010. The findings found mail sent later was more effective at increasing turnout. Taken together, these experiments offer some support for messaging closer to Election Day (Murray & Matland 316 & 317). If operationally feasible, it will be more effective for NCO to buy more billboard advertisements for a shorter time period closer to election.
(3) Conduct Individual-Level Analysis using Voter File
The last recommendation is to replicate and improve this analysis by conducting the experiment at an individual-level through voter file analysis during another election. Measuring individual-level turnout results by using the voter file will dramatically increase the sample size, ultimately, increasing the ability to detect a statistically significant effect on turnout rates. Additionally, if the analysis is conducted at an individual-level, network analysis tools in ArcGIS can be employed to identify individuals driving time to a billboard from their home address, a much more precise measurement than what was utilized in this analysis. An individual-level analysis will also provide insights into whether billboards have different effects on particular subgroups, such as racial or various income-bracket populations.
SECTION 5. CONCLUSIONS
Quantitative analyses serve as an important step in improving voter turnout efforts in elections. This analysis is designed to both contribute to the existing literature on billboard GOTV research, and serve as a guide to researchers and practitioners alike. Taking these initial recommended steps outlined above will help NCO can build upon its data-driven strategy to cost-effectively improve voter turnout.
SECTION 6. REFERENCES
- Dale, Allison, and Aaron Strauss. “Don’t Forget to Vote: Text Message Reminders as a Mobilization Tool.” American Journal of Political Science, vol. 53, no. 4, 18 Sept. 2009, pp. 787–804.
- Cunningham, A., and R. Coleman. “Outdoor Recall: An Examination of Outdoor Advertising Recall Effectiveness.” OAAA, 2003.
- DeSilver, Drew. “U.S. Trails Most Developed Countries in Voter Turnout.” Pew Research Center, 15 May 2017, www.pewresearch.org.
- FairVote.org. “Voter Turnout.” FairVote, www.fairvote.org.
- Franz, Michael M. Campaign Advertising and American Democracy. Temple University Press, 2007.
- Green, Donald P., and Alan S. Gerber. Get Out The Vote: How To Increase Voter Turnout. Brookings Institution Press, 2015.
- “Hampton Roads.” Hampton Roads Transit RSS, gohrt.com/.
- Keating, Dan and Kevin Uhrmacher. “An Enthusiastic, Even-more Polarized Virginia Electorate Gave Northam the Win.” The Washington Post, WP Company, www.washingtonpost.com.
- Leighley, Jan E. The Oxford Handbook of American Elections and Political Behavior. Oxford University Press, 2013.
- Murray, Gregg R., and Richard E. Matland. “Mobilization Effects Using Mail.” Political Research Quarterly, vol. 67, no. 2, 2013, pp. 304–319.
- Panagopoulos, Costas, and Shang E. Ha. “Billboards and Turnout: A Randomized Field Experiment.” Journal of Political Marketing, vol. 14, no. 4, 2015, pp. 391–404.
- Panagopoulos, Costas. “Street Fight: The Impact of a Street Sign Campaign on Voter Turnout.” Institution for Social and Policy Studies, 2006.
- Pieters, Rik, et al. “Visual Attention to Repeated Print Advertising: A Test of Scanpath Theory.” Journal of Marketing Research, vol. 36, no. 4, 1999, p. 424.
- “Registration and Turnout Statistics.” Virginia Department of Elections, www.elections.virginia.gov.
- Rosenstone, Steven J., and John M. Hansen. Mobilization, Participation, and Democracy in America. Longman, 2003.
- Sacharin, Ken. Attention: How to Interrupt, Yell, Whisper, and Touch Consumers. Wiley, 2001.
- Sides, John, and Andrew Karuch. “Messages that Mobilize: Issues Publics and the Content of Campaign Advertising.” Journal of Politics, vol. 70, no. 2, 2008, pp. 466–476.
- “US Traditional Media Ad Benchmarks: CPM, by Media and Type, 2005 & 2015.” Media Dynamics, Inc, 2016.
- Verba, Sidney, et al. Voice and Equality: Civic Voluntarism in American Politics. Harvard University Press, 2002.
SECTION 7. DESIGN