The impact of permanent early voting field outreach on voter turnout in Arizona

Analysis by Sarah Michelsen, Arizona State University, PAF 573, November, 30 2015. NB: Permanent Early Voting is an Arizona-specific term. Most other states that offer something similar call it "permanent absentee voting" or "single-signup"
Voter Participation in Arizona
In November 2014, only 47.52% of Arizona’s registered voters participated in the midterm elections (Arizona Secretary of State, 2015), representing only 31.4% of the state’s voting-age citizen population (United States Elections Project, 2015). Turnout for the statewide general election in 2014 was the lowest since 1998. This is a prominent problem not only in Arizona but nationally; in 2014 only 26.6% of the United States citizen voting-age population participated in the general election (United States Elections Project, 2015).
In Arizona as in other states, this problem is most pernicious with under-represented communities. Communities of color and young people have much lower rates of registering to vote and turning out than white and older voters (Wolfinger and Rosenstone, 1980). In Arizona, communities of color make up 34.7% of the state’s population (American Community Survey, 2013), but only 29.6% of registered voters (Voter Activation Network, 2015). In 2014, they made up only 23% of the voting electorate (Voter Activation Network, 2015). These numbers are even starker for Latino voters, who make up 29.9% of the state’s population (American Community Survey, 2013) but only 16.77% of registered voters (Voter Activation Network, 2015). This underrepresentation leads to disenfranchisement and political results that only serve to further alienate marginalized communities from the civic process.
There are many policy solutions that have been shown to increase registration and turnout, through structural changes to the election system that increase ease and visibility of registration and voting. California and Oregon have both recently passed automatic voter registration laws, requiring the Department of Motor Vehicles to register anyone being issued a state ID or driver’s license to vote. These were just passed by ballot initiative in 2014 so there is not yet evidence to show whether or not they will increase turnout, but other countries with automatic voter registration have much higher turnout rates than the United States. Australia, Sweden,
Argentina, Belgium, and Germany all have automatic and voter registration systems (Rosenberg & Chen, 2009), and the average turnout in each of these countries is above 83% (Franklin, 2001), much higher than in the US, where in Presidential years turnout has been between 52% and 65% of the voting eligible population since the 1940s, and in mid-term years, turnout hovers in the mid 30’s (FairVote, 2014).
Same-day voter registration, also called Election Day registration, has been enacted in 11 states plus the District of Colombia, allowing voters to register to vote and cast their ballots all at once on Election Day (National Conference of State Legislatures, 2015). Many studies have shown that same-day registration increases voter turnout by 3 to 5 percentage points. However, while it tends to increase the number of people voting and can close the gap between young and older voters, it does not close the larger demographic gaps due to race and educational attainment (Knack and James, 2000).
Vote-by-mail, either as an option or implemented as the sole method of casting a ballot, has also been tried as a way to make voting more convenient for citizens. No-fault absentee voting, in place in 27 states, allows voters to elect to vote by mail without having to provide a qualified excuse, as is required in 20 states (Harmon et al, 2015). Washington, Oregon and Colorado have all-mail election systems, in which every voter receives a mail-in ballot. In their 2000 study of Oregon’s all-mail system, Southwell and Burchett found that the new system increased voter turnout by 10% over polling place elections (Southwell and Burchett, 2000).
Arizona has several policies in place that make voting more accessible: online registration, early in-person and by mail voting, and permanent absentee voting, in which voters can elect to receive their ballot by mail for every election. This last policy is the subject of much controversy in Arizona, in part due to the large-scale civic engagement programs operated by civic engagement organizations to increase its use. This policy is the subject of this analysis.
The Permanent Early Voting List (PEVL)
In 2007, Arizona voters passed a ballot initiative creating the Permanent Early Voting List (PEVL). It allows registered voters to elect to receive their ballots by mail for every statewide election (Arizona Secretary of State, 2015). According to proponents, having the PEVL as an option for voters provides many potential benefits: making voting more convenient, especially for elderly, disabled, or rural voters, increased access for marginalized groups who may be more likely to experience difficulty voting, and increased participation (Heredia, 2015).
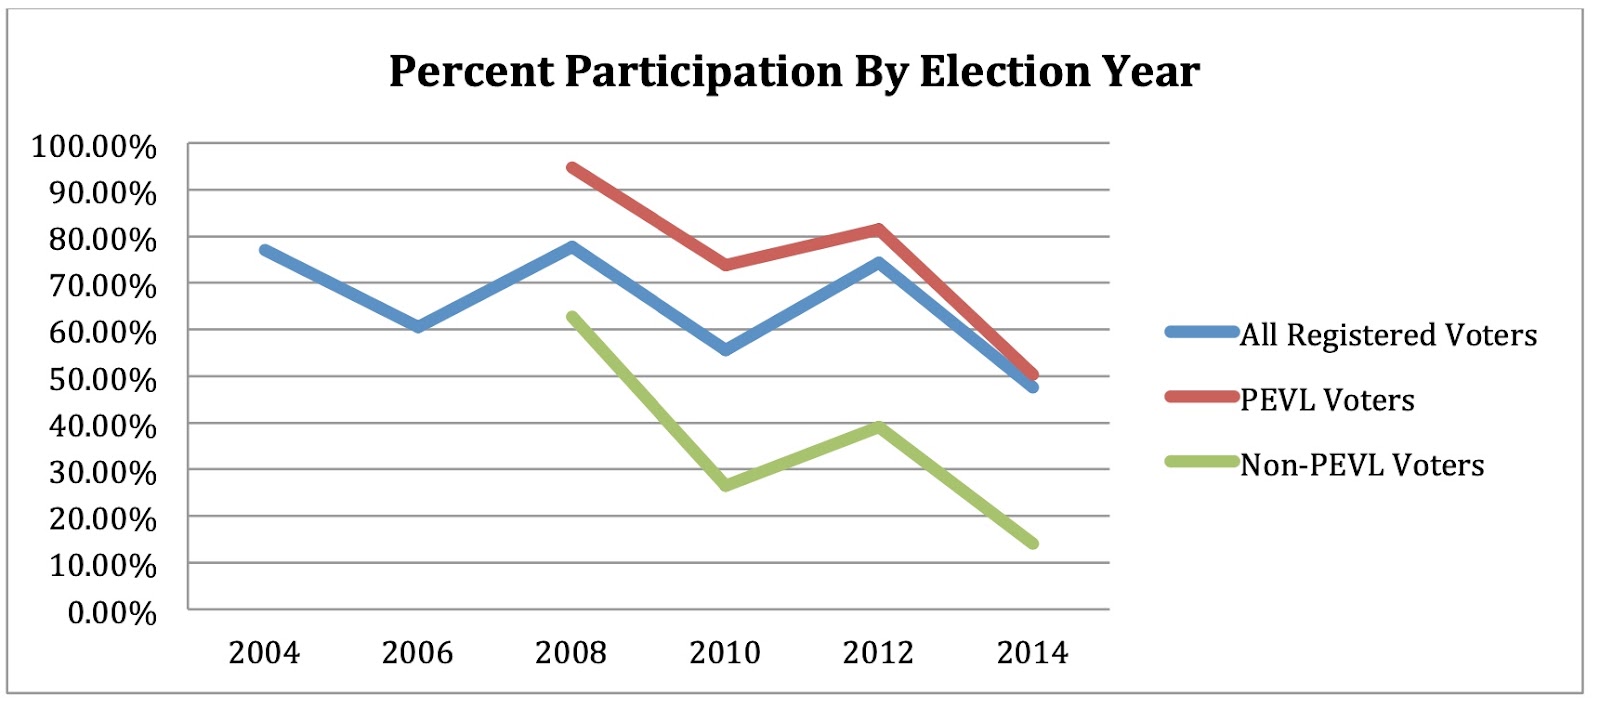
According to the Arizona Secretary of State’s office, currently 1.8 million Arizona voters are on the PEVL. In 2012, 78.9% of PEVL voters participated in the general election, as opposed to 44.8% of non-PEVL voters (Arizona Secretary of State, 2015). This disparity has been observed in every election since the PEVL was instituted, as demonstrated by the chart below. This observation has led to the assumption that being on the Permanent Early Voting List makes a voter more likely to vote, and is the basis for large investments by community organizations in moving registered voters with low participation rates onto the PEVL.
One Arizona Civic Engagement Programs
One Arizona is a coalition of civic engagement and issue advocacy non-profit organizations operating at a state level in Arizona. The coalition was formed in 2010, in response to SB1070, a law legalizing racial profiling that caused a national outrage and catalyzed the movement for immigrant rights in Arizona. The coalition members felt that they could best influence public policy by engaging the Latino community and magnifying the voices of these communities through issue engagement and election participation.
According to former One Arizona Executive Director Francisco Heredia, a major component of the civic engagement efforts of the coalition consist of large-scale canvassing, phone, and mail programs to convince low and mid-propensity Latino voters to sign up for the Permanent Early Voting List. In recent years the coalition partners have expanded their constituencies to include other communities of color in addition to Latinos, as well as young people (under age 35) and unmarried women. These groups together are referred to as the “New American Majority” (NAM) in the civic engagement community (Heredia, 2015).
The door-to-door canvassing programs are operated slightly differently by each group in the coalition, sometimes by volunteers but most often by paid field staff Lists of voters targeted to receive door-knocks are created by program directors, and differ by organization, but generally include Latino, young, and unmarried voters with low modeled propensity to vote. Canvassers use different scripts according to the issue environment of the time, often having conversations with voters about immigration policy, education, or the economy, and making a compelling argument for voting as a way to solve policy problems. Canvassing staff are provided with intensive training, and are skilled in having these conversations, which end with a pitch to sign up for the Permanent Early Voting List. Voters fill out and sign a form indicating that they want to be placed on the list, which is then submitted to County Elections departments by the organizations (Heredia, 2015).
Below is a sample script from a One Arizona program:
- Hello, is _________home? (Ask for person on your list).
- Hi, my name is ___________, I’m a volunteer with the community organization (YOUR ORG), as part of the One Arizona Campaign. We are building a movement for change in Arizona, so that all families who live in this state have an equal voice.
- How are you today? …… Great! Today, we are talking to registered voters in your neighborhood about the upcoming elections. Will you commit to vote in this year's election? There are important local elections this year, such as city council, mayor, and propositions.
- (Yes/No) (If yes, have voter sign Pledge Card)
- This year the city of Phoenix will have an election to vote on various council seats and the Mayor. The election will also include a bond question – Proposition 104 – which will ask voters to vote on comprehensive transportation improvements, including extended light rail, additional routes, road improvements, and other improvements paid for by an increase of the sales tax from 4 cents to 7 cents. What are your thoughts?
- (Support/Oppose/Not Sure/ Need more information)
- Arizona Statewide Minimum Wage is currently at $8.05. Would you support an increase to the State Minimum Wage? If so, of which of these hourly wages would you support to increase it to $10.00, $12, $14, $15? (No Support/$10/$12/$14/$15/None)
- (Check the list to see if they are already on PEVL, verify with voter they are, if not ask the following question, if already on PEVL start ending the conversation.)
- Do you want to sign up on the Permanent Early Voting List (PEVL)? If you are on this list you will be receiving your mail ballot at home 26 days before every election (local or statewide).
- (Yes/No/Already PEVL/Not Sure)
- Are there any additional individuals in the household who are not registered to vote or who are registered and are not receiving their mail ballot?
- Thank you for your time and have a nice day!
These scripts are meant to be a guide, and are not read verbatim but give canvassers a list of talking points and questions to make sure they ask. Experienced canvassers have their own “raps,” and make the script their own. Persuasion techniques, answers to tough questions, and how to handle suspicious or confrontational voters are part of daily training and debrief sessions for canvass teams.
In the field, canvassers use iPods or smart phones with an app called MiniVAN to access their script and list of voters, with addresses, maps, and demographic information. Scripts and lists are sent to individual canvassers’ accounts by the team lead daily. The answers to the questions in the script are recorded by the canvasser inside the app while talking with the voter at the door, and are immediately updated in the database when the device is connected to Wi-Fi.
Research Question and Hypothesis
While it is easily observable that voters who are on PEVL have higher probability of voting than non-PEVL voters, what is unknown is the effect of being signed up for PEVL through a One Arizona coalition field program on vote propensity, and how it compares to the effect of becoming a PEVL voter through some other means, ostensibly, on one’s own volition.
The goal of this research is to examine the assumption behind civic engagement programs that signing up voters for the Permanent Early Voting List through field outreach increases participation in voting among the New American Majority. This paper will address the question of whether PEVL voters participate more because they are on PEVL, and it simplifies the process, or because they are already more likely to vote due to demographic factors and internal motivation to vote, and are self-selecting into the list due to this motivation. Highly-motivated voters are more likely to sign up for PEVL of their own volition. If the difference between PEVL and non-PEVL voters is due in large part to this self-selection effect, then field programs to sign up low and mid-propensity voters for the PEVL would be misguided. Voters signed up through these programs may not be as motivated to vote as voters who seek out the PEVL on their own. Alternatively, it is possible that voters signed up through One Arizona programs have higher program effects than self-selected PEVL voters, measured as the difference in vote propensity from the non-PEVL (control) group. One Arizona programs consist of a convincing pitch, so there is a possibility that this connection to community organizations and hearing a compelling argument actually increases voting behavior more than choosing to sign up for PEVL on one’s own.
The design of this analysis is supported by previous literature that has sought to isolate motivation as a variable in order to understand how election administration policies and procedures impact turnout. In his 1997 paper “Easy Registration and Voter Turnout,” Highton questions evidence that registration obstacles are the primary factor leading to demographic disparities in turnout. He theorizes that non-voting is concentrated among the unregistered, not because being registered to vote causes people to vote, as previous research had concluded, but because people who are interested in voting register to vote. In order to analyze how non-registered voters behave when they become registered, he analyzed states with policies that allowed for registration and voting with low or no social costs: election day registration in 3 states and one state which did not require registration (Highton, 1997).
Similarly, this analysis seeks to isolate motivation in order to determine whether PEVL voters have higher turnout rates because they are on PEVL, or because they are interested in voting, which also caused them to seek out PEVL Status. The group of voters recruited to the PEVL by One Arizona programs is similar to Highton’s easy-registration state group; they would be non-PEVL voters if not for the intervention allowing them to become PEVL voters with almost no social costs. However, using a fixed-effects regression model allows the analysis to be taken one step further, by controlling for individual fixed effects by looking at changes in individual probability to vote before and after for each group. Specifically, this analysis will determine the effect that being on the Permanent Early Voting List has on probability to vote, when controlling for motivation and other individual fixed effects, for two treatments: recruitment to PEVL through One Arizona field outreach programs, and getting on PEVL through other means. My hypothesis is that the effect on vote propensity of being signed up for PEVL through a One Arizona program will be positive, but not as strong as the effect of signing up for PEVL through self-selection.
Dataset
The data used for this project comes from the Voter Activation Network, which is a database of voter information supplied by America Votes, a non-profit coalition of national and state-based progressive organizations. Catalyst, the vendor that supplies the data for the database administered by America Votes, purchases the State Voter File from the Arizona Secretary of State. I accessed the America Votes Voter Activation Network (VAN) through Arizona Wins, a subscriber to this database and my employer.
The dataset used for this analysis includes individuals registered to vote in Maricopa and Pima counties, who registered between 2004 and 2012. There are 521,560 unique individuals included, and 2,619,151 observations of individuals in a given year. The dataset is panel data, in long form, and the unit of analysis is the individual in a given year. Each individual has one row for every year that they were a registered voter from 2004-2014. General elections are held every two years, in the even year, so individuals have one entry for every even year that they were a registered voter.
The dataset includes unique identifiers for individuals, demographic data, and voting history from 2004 to 2014. These dates were chosen so that there would be data on PEVL voters from before the policy was instituted in 2008. The vote history data consists of dummy variables indicating whether or not the individual voted in the statewide general election in that year. The dataset also includes data on PEVL status, and the year the voter signed up for PEVL. In addition to this data from the America Votes VAN, also included is whether a voter was signed up to PEVL by a One Arizona recruitment program, and the date. This data came from One Arizona, from a list compiled from data collected by canvassers in the field. One Arizona started conducting PEVL recruitment programs in 2010, so the recruitment dates are all between 2010 and 2015. One Arizona coalition partners recruited 10,156 to the PEVL people over these 5 years.
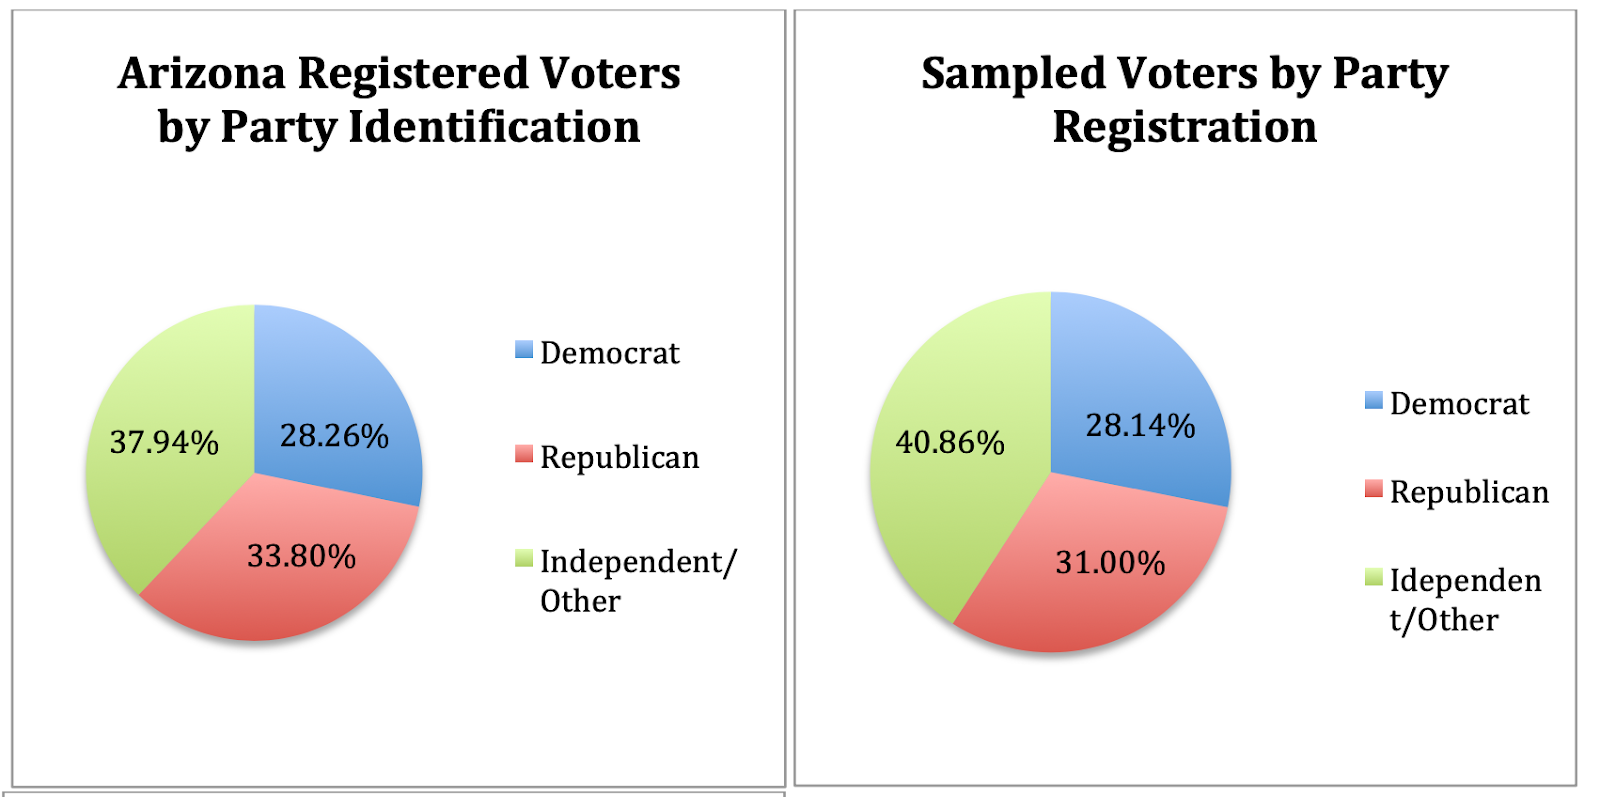
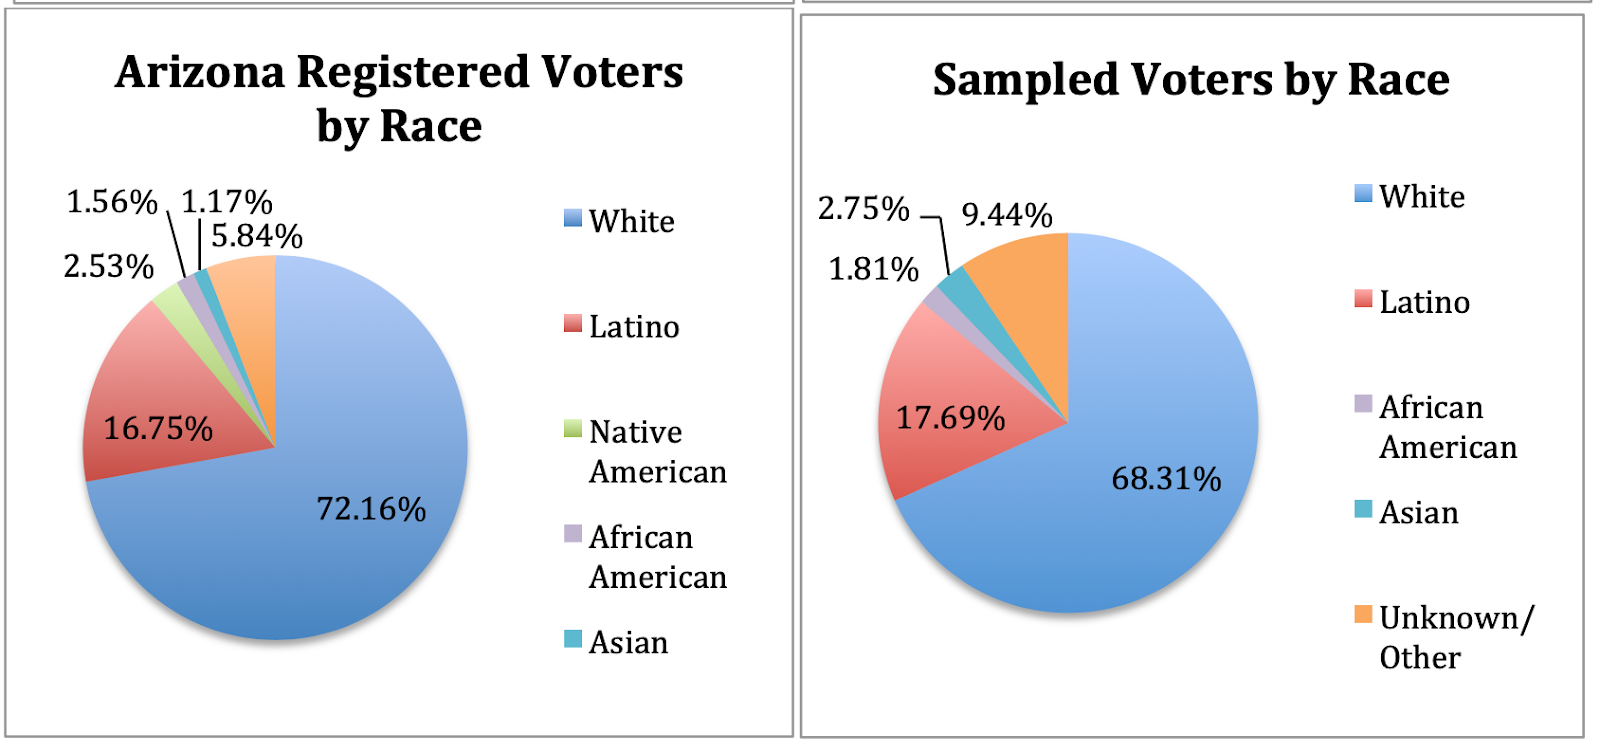
The sample of voters contained in the dataset closely mirrors the state in proportions of voters by party identification. 33.8% of Arizona voters are registered Republicans, 28.26% are registered Democrats, and the remaining 37.94% are Independents (registered with no party) or registered to small parties. The sample is also similar to the state in the proportion of ethnic groups. The sample data does not have an indicator for Native American ethnicity, so Native voters are grouped with Unknown/Other.
The voters recruited by One Arizona look a little different than the state or sample as a whole, in both race and party identification. This is due to the nature of the programs, which target low-propensity Latino voters, young people, and unmarried women. These demographic groups are overrepresented, and because those groups tend to lean democratic overall, Democrats are also overrepresented.

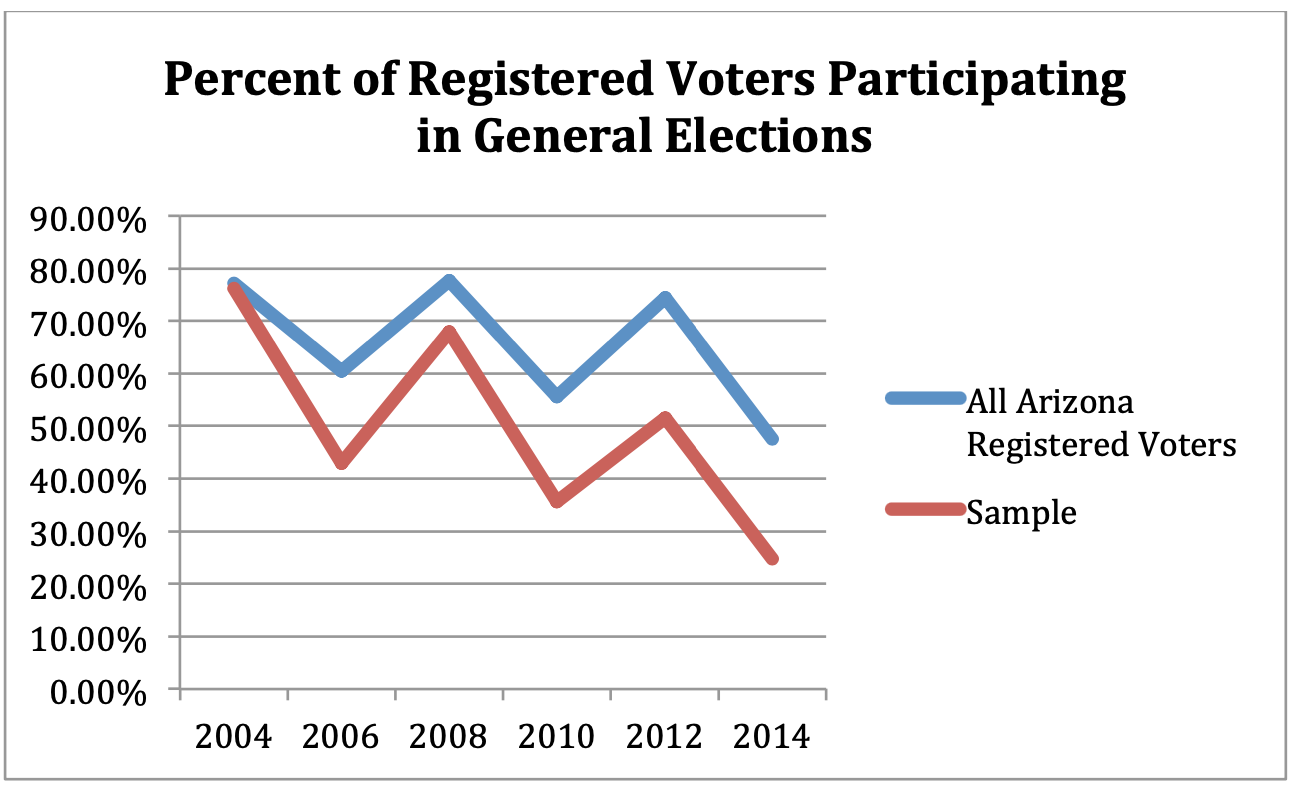
One limitation of the dataset is that the rate of participation in elections is lower in the sample than the reported statewide participation for every year, with the gap increasing over time, as shown in the chart below. This discrepancy could bias the results, and further research with a more complete dataset is needed to increase the accuracy of the estimates.
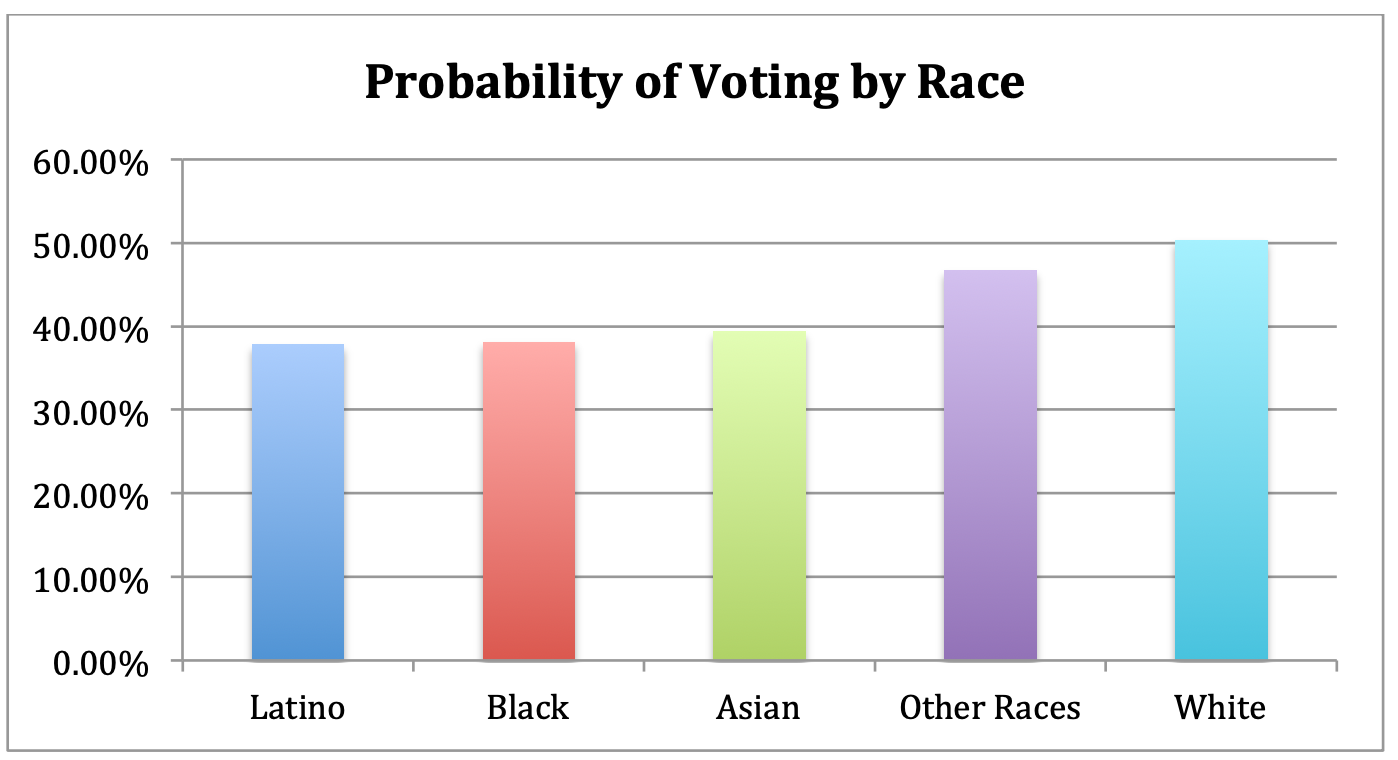
Vote Propensity Comparisons of Demographic Groups
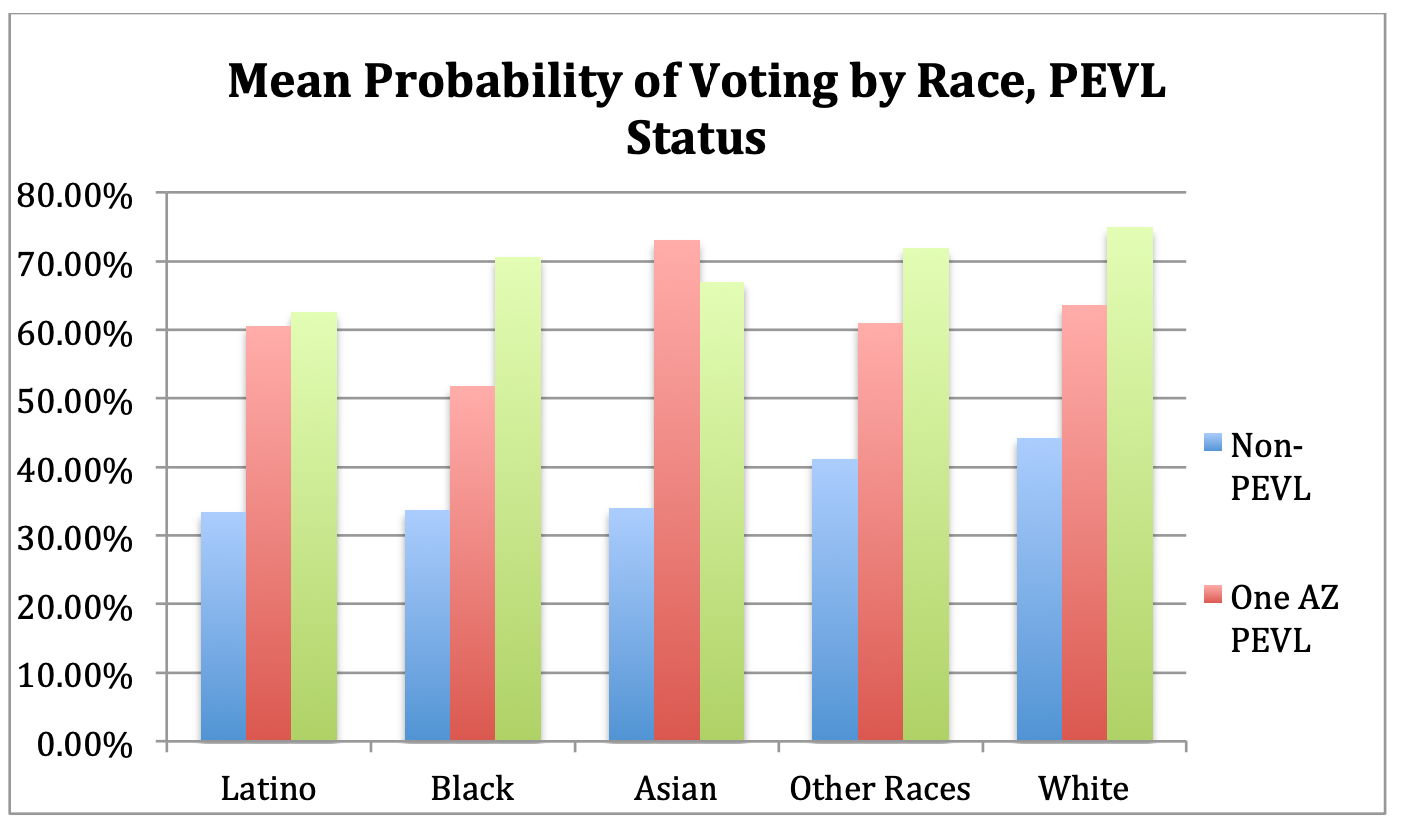
Important to this analysis is an understanding of the differences in propensity to vote among different groups. Both the literature and the data used here support differences in racial/ethnic groups in vote propensity, as well as differences among those registered with a party and independent voters. The chart below shows the mean probability of voting by race, measured as the mean of the dummy variable for whether or not an individual voted in a given year. In this sample, white voters are the most likely to vote in any given year, and Latino voters are the least likely to vote. This discrepancy is expected, given the literature on ethnicity and voting, and the known discrepancy in Arizona voters from the voter file. For example, in 2014, 49.03% of white registered voters participated in the general election, compared to 27.48% of Latino voters (Voter Activation Network, 2015).
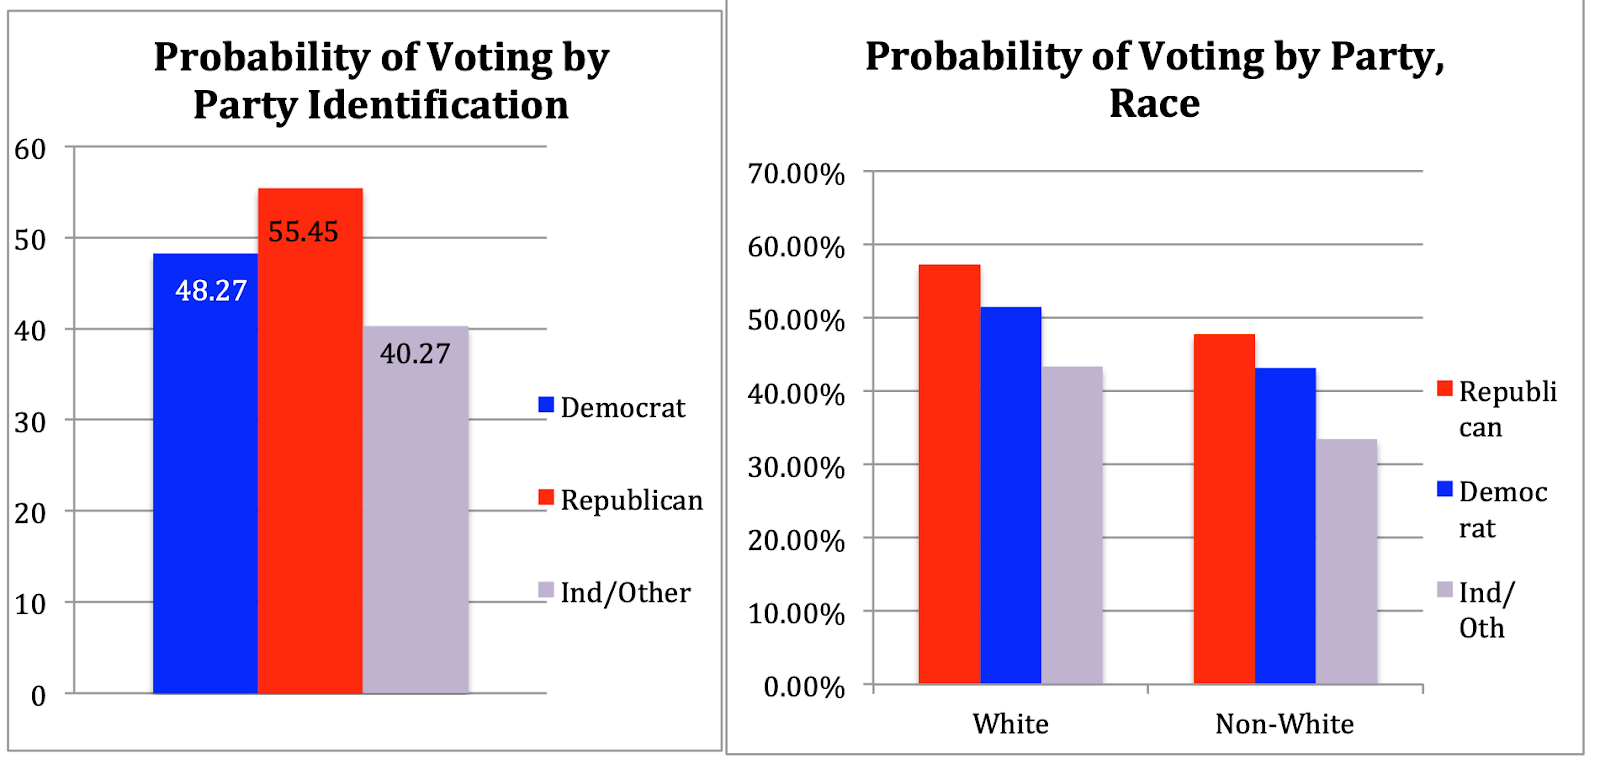
The chart below shows the probability of voting by party identification. Republicans are slightly more likely to vote than Democrats, and all partisan voters are more likely to vote than independents. In this sample, Democrats are 59.03% white, while Republicans are 79.19% white. White voters have higher propensity to vote, so it important to determine whether the difference in propensity to vote is simply due to the different racial makeups of the partisan groups. The second chart shows that the party difference holds even when broken down by race.
Differences in Vote Propensity by PEVL Status
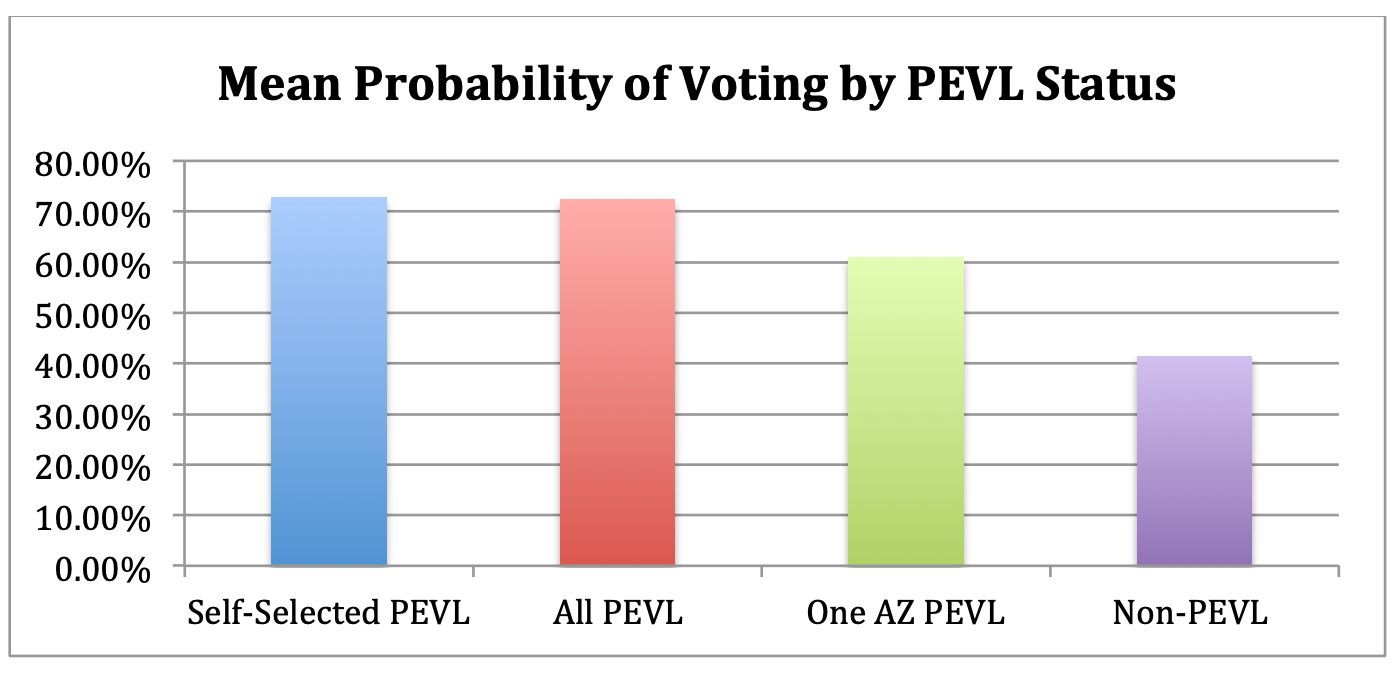
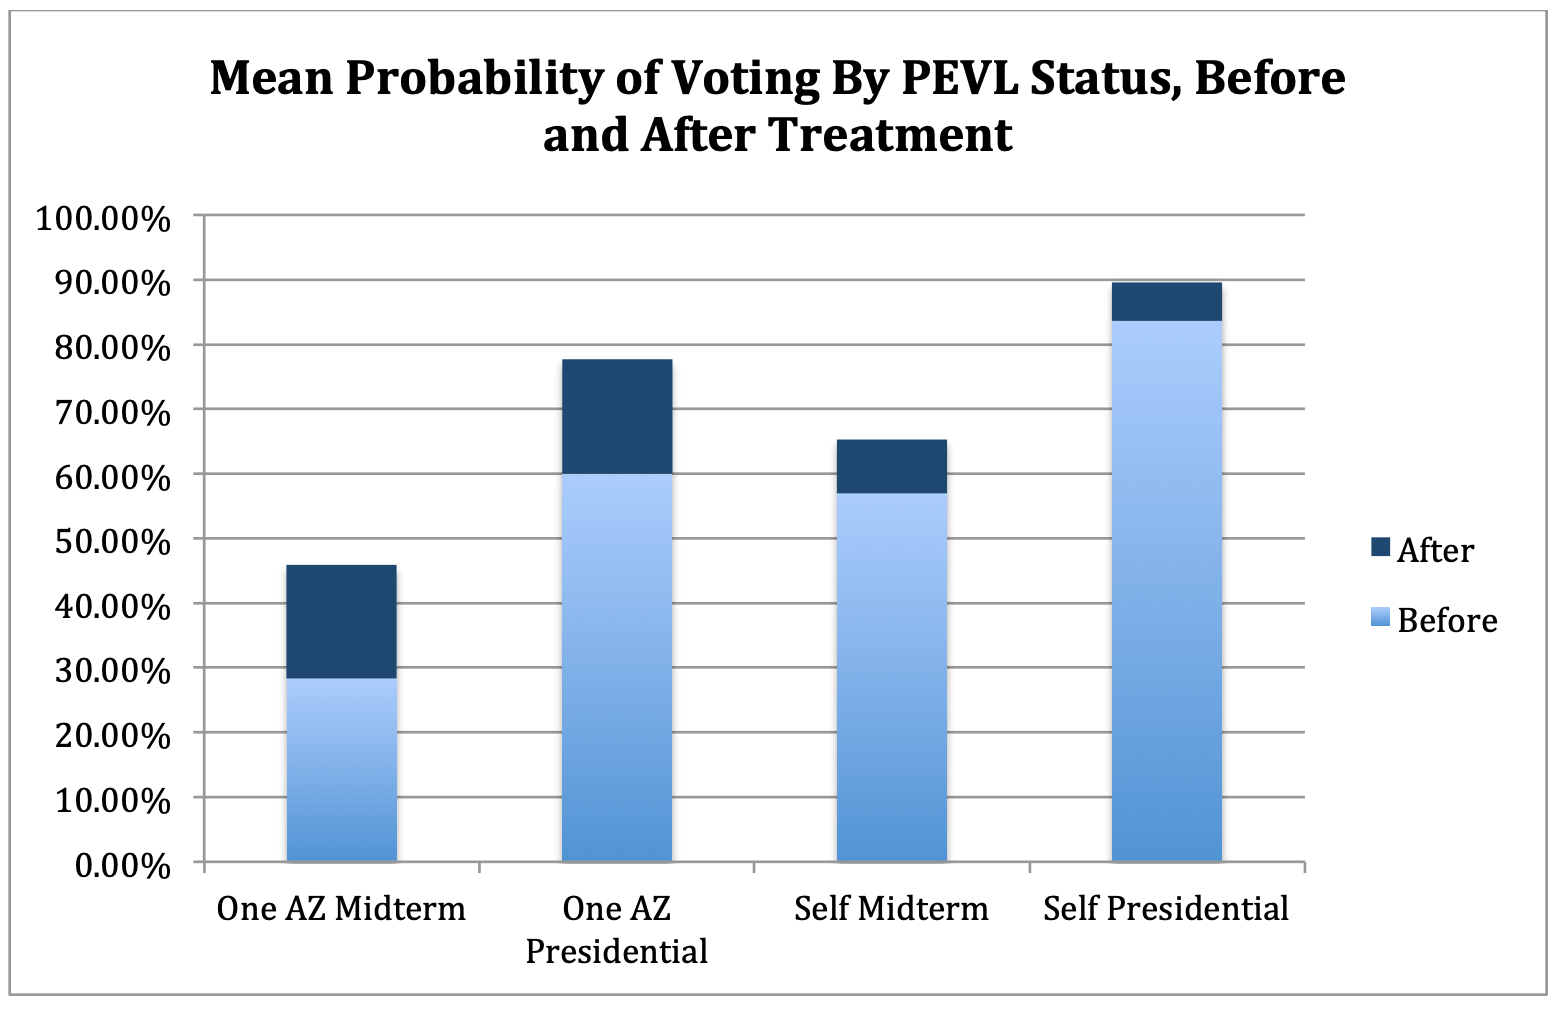
The difference that is the main subject of this analysis is the difference in probability of voting based on PEVL status. Firstly, it is important to note the probability to vote that the two treatment groups had before either group was “exposed” to the PEVL treatments. The group that is currently on PEVL and was recruited by One Arizona had a mean probability to vote of 43.74% before they were on PEVL. The self-selected PEVL group had a mean probability to vote of 70.18% before they were on PEVL. This demonstrates how different these two groups are starting out. One group is made up of low-propensity voters, mainly people of color, who have been targeted by community groups and given a convincing pitch about the importance of voting and voting by mail. The other group is highly motivated voters, quite likely to vote already, and mainly made up of white voters, who have sought out ways to make voting easier for themselves, through the state’s permanent vote by mail program.
The mean probabilities of voting for individuals, including years both before and after the PEVL treatment, are shown below. These means add evidence to support the hypothesis that moving non-PEVL voters to PEVL status through a One Arizona program increases their probability of voting, but not so much that they have as high a probability of voting as voters that self-select into voting by PEVL.
The effect of PEVL on propensity to vote can also be shown using a simple Ordinary Least Squares regression model, showing the correlation between likelihood to vote and PEVL status. The first model gets the baseline coefficient for all PEVL voters, and the second model breaks this down into the two PEVL conditions: One Arizona recruits, and self-selected PEVL voters.
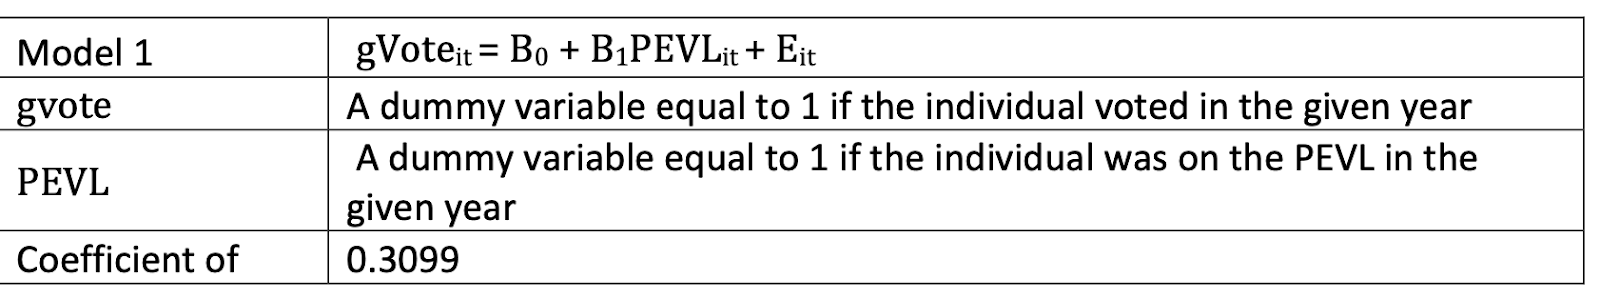

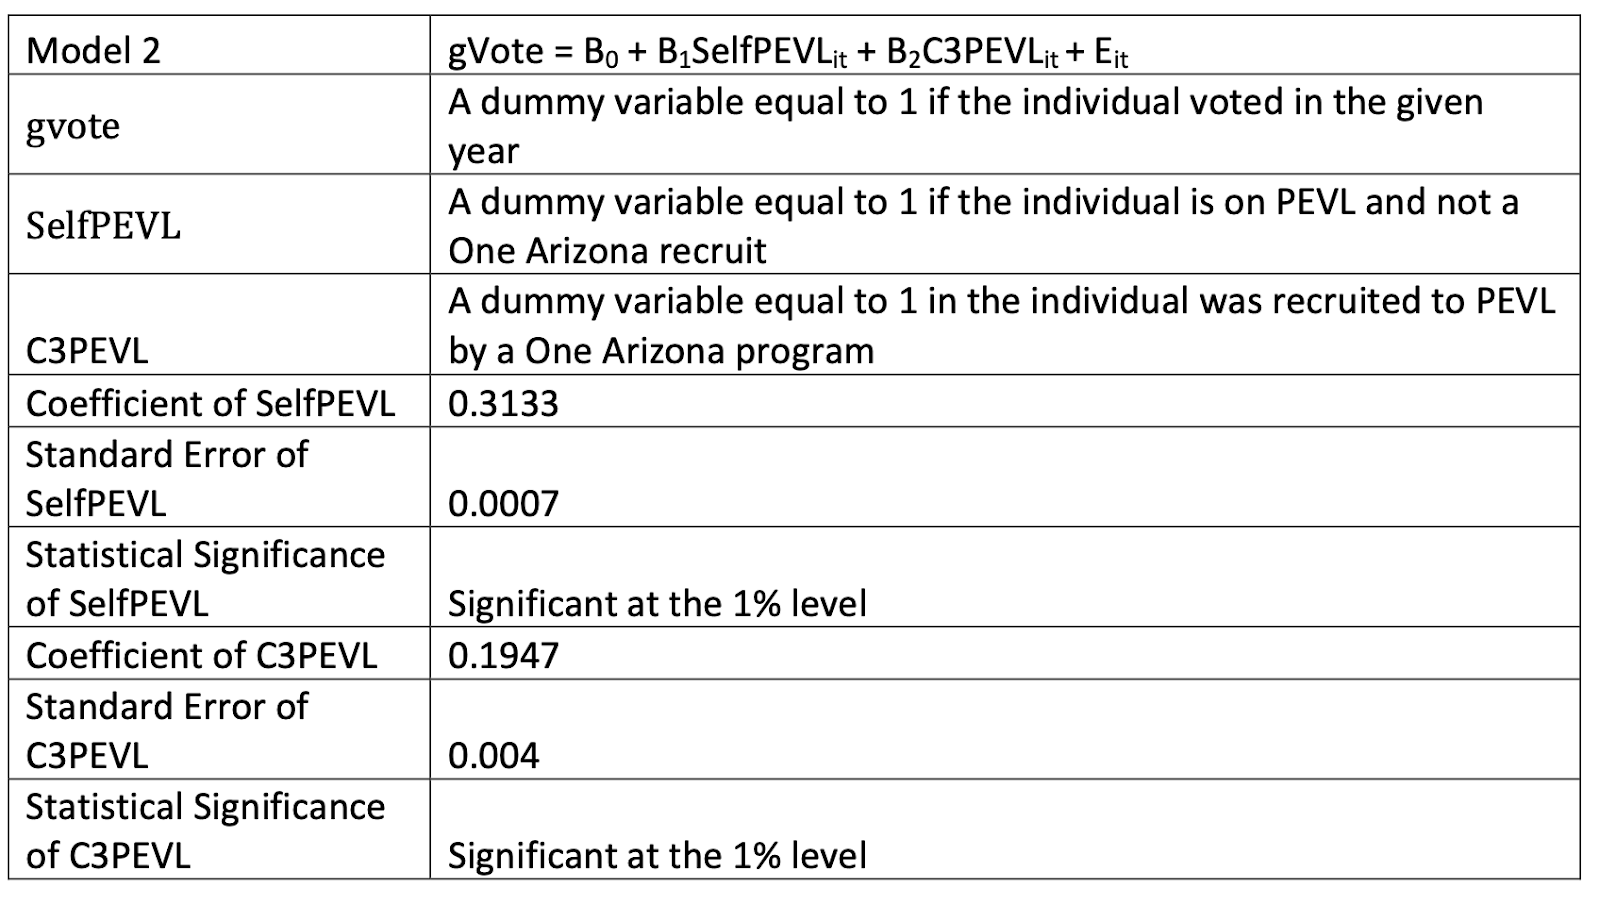
The interpretation of these results is that generally, PEVL voters are 30.99% more likely to vote than non-PEVL voters. Voters who signed up to PEVL on their own are 31.33% more likely to vote than non-PEVL voters, and One Arizona PEVL recruits are 19.47% more likely to vote than non-PEVL voters. These results reflect the same information as the mean probability to vote analysis, that PEVL voters are much more likely to vote than non-PEVL voters, and those who sign up themselves are more likely to vote than those signed up through One Arizona programs.
When broken down further by race, we can see the effect that PEVL has on different groups. The same pattern holds; with the exception of the Asian community, voters of all ethnicities have a higher probability of voting when recruited to PEVL by a One Arizona Program than if not on PEVL, but a lower probability of voting than voters who signed up to PEVL on their own. There are only 193 Asian voters who were signed up through One Arizona programs, so their results may not be representative.
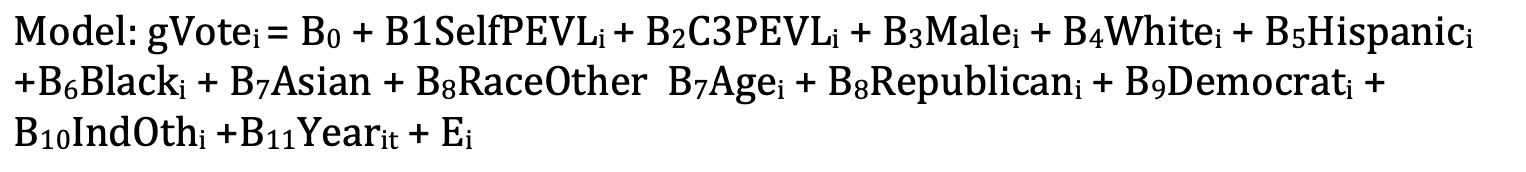
Using an OLS model with controls for race, gender, age, party identification, and year gives a closer look at the effect of each PEVL condition, as well as the effect of belonging to a specific demographic group, and year effects. All variables are dummy variables, equal to one for the condition named, except age, which is a continuous variable.

In this model, the coefficient for the One Arizona recruit group is actually higher than the self sign-up PEVL voters. The coefficient for the self-PEVL group has not changed much from the simple OLS model with no controls, moving from 31.33% to 34.53%, but the One Arizona PEVL group coefficient changed significantly, from 19.47% to 34.53%, more than a 15 percentage-point change.
One potential reason for this may be that the One Arizona voters, who are low-propensity voters to begin with, are much more susceptible to changes in behavior based on year than self-selected PEVL voters. The year effects are striking, and make sense with what we know about election participation in each year. The presidential election years, 2008 and 2012, have higher (although still negative) coefficients than the mid-term election years following them. 2014 had abysmal turnout, at only 47.52% statewide, so it makes sense that the coefficient is so low. This is interpreted to mean that a voter in 2014 was 63.5% less likely to vote than a voter in any other
given year. These effects seemed to have a much larger effect on One Arizona recruits than other PEVL voters, because when they are controlled for the coefficient of One Arizona PEVL voters changes so much, indicating these variables were suppressing the effect of recruitment in the previous models. This makes sense if we think of the One Arizona recruits as low propensity voters, somewhat unlikely to vote, and much less so in a bad turnout year, and self-PEVL voters as more self-motivated, consistent voters, and therefore less likely to fail to vote in years when turnout is low.
The chart below demonstrates these differences by examining how the mean probability to vote in the two treatment groups differs by whether the year is a Presidential or midterm election year. These changes in means show the effect of the One Arizona program PEVL treatment as much larger than the self-selected group’s effect, indicating that there might be missing variables biasing the coefficient of the self-selected PEVL treatment in the OLS model. Splitting the means by election type shows how the year affects turnout rates.
These results are useful for program planning purposes, because they show the difference in likelihood to vote between non-PEVL and recruited-PEVL groups, showing that these programs are likely effective. The results for Latino voters are particularly interesting. Latinos recruited by One Arizona are closer in probability to vote to Latinos who self-selected into PEVL than any other racial/ethnic group. This may be due to the focus of Latino-based community organizations, which employ mainly Latino canvassers, talking to Latino voters about issues important to their community. This tactic may be what leads to a bigger effect of the program on Latino voters than voters of other races. It seems to be motivating enough that it has a similar effect to self-motivation; the effect is closer to that of the self-motivated group in the Latino community than for any other group.
However, we cannot conclude from these results that One Arizona programs are effective at increasing voting behavior without looking at individual before and after effects. Both the means and the OLS results reflect the correlations between being in a specific group and voting behavior, but not how being in that group changed an individual’s behavior from their previous habits. It is possible that the individuals recruited by One Arizona were the highest propensity voters among the organizations’ targets, and that they had more consistent voting behavior before they were recruited to PEVL, meaning this group looked different than the non-PEVL group even before being recruited to PEVL.
We also cannot conclude from these results that self-selection into PEVL increases voting behavior more than being recruited by a One Arizona program. The self-selected group has a higher average probability of voting, but they also likely started with a higher probability, before signing up for PEVL. The two groups are not randomly selected nor are they comparably similar; there is a self-selection motivation variable that needs to be controlled for, and the groups are demographically different. The One Arizona PEVL recruits are majority Latino, while the self-selected PEVL group is majority white. One Arizona specifically targets voters with a Catalyst modeled low-propensity score, so this group is less likely to vote before being recruited to PEVL.
These results give us an estimate of what is likely to happen, but not an estimate of the true effect of either PEVL condition on an individual voter. To examine the question of how PEVL changes behavior, in either condition, a regression model that can examine individual behavior before and after that individual signs up for PEVL is needed.
Fixed Effects Model: Individual Before and After PEVL Effects
To examine the effect of the two PEVL conditions, a fixed effects model is used to compare the behavior of individuals before and after the PEVL treatments. By using the individual before they were “treated” with the PEVL condition as the comparison group, fixed effects allow the examination of change in each individual over time, and coefficients give the true effect of the condition.
Fixed effects controls for all individual characteristics that are non-time varying, such as demographic factors and motivation to vote, so those are left out of the model. The time-varying control, election year, is used as a control in this model. Age, the other time-varying variable, is left out due to collinearity. The variable A represents the individual fixed effects.


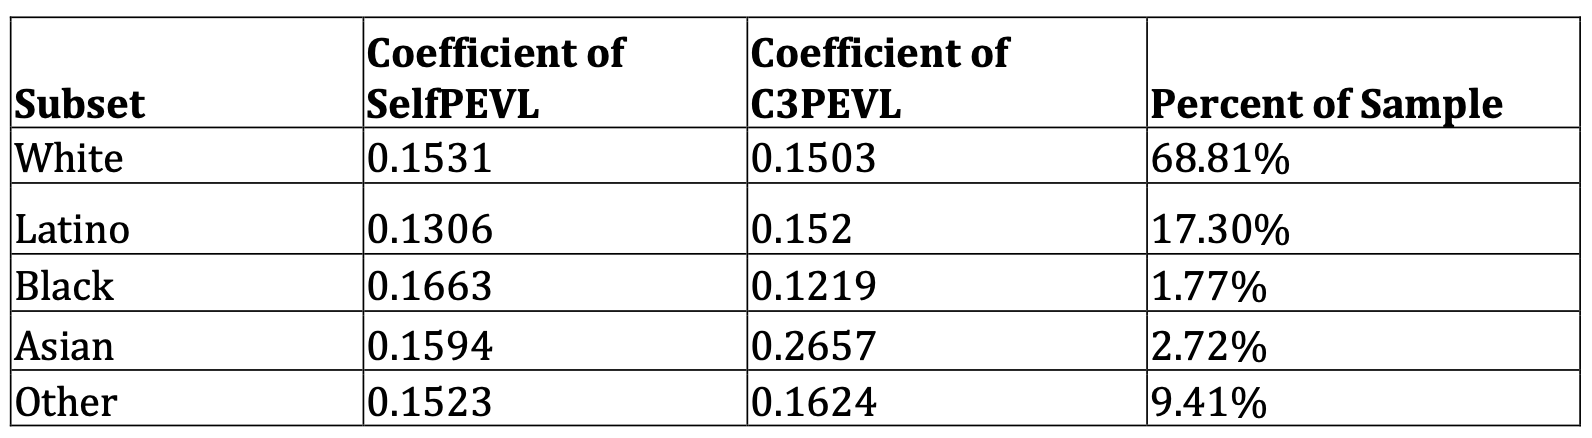
This same model was applied to subsets of the data to examine the effects of the PEVL treatments on different racial groups, as well as different party-identified individuals.
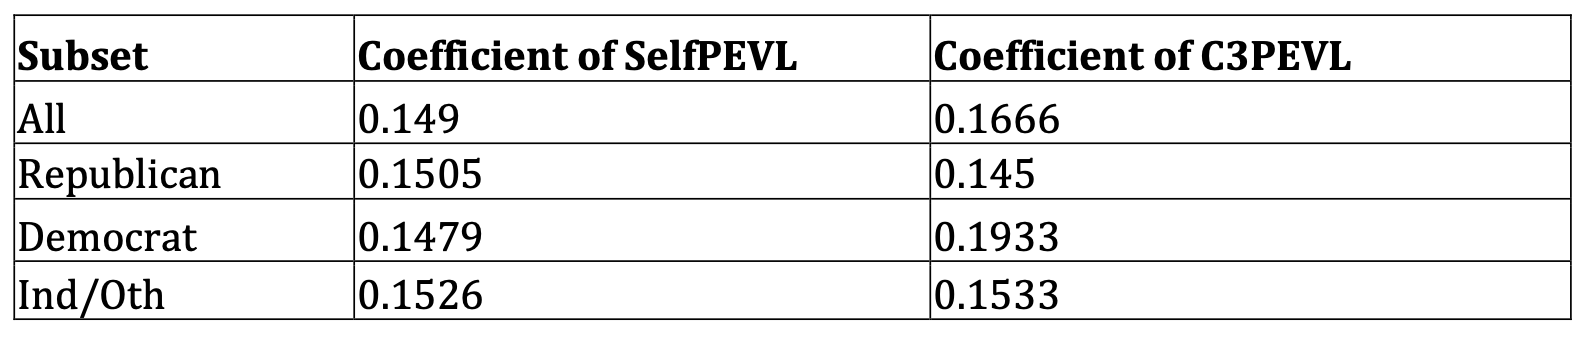

The black line represents the coefficient for all voters, the average effect.
Lastly, the model was run on subsets of the data by type of election year, to examine the differences in the effect of PEVL in Presidential and midterm election years. Presidential years have much higher turnout for all races, both nationally and in Arizona. This difference is crucial for understanding how PEVL and One Arizona programs can increase turnout in a particular election.

Conclusions
The coefficients in the overall fixed effects model are interpreted to mean that individuals who sign up for PEVL on their own are 14.9 percentage points more likely to vote than before they were on PEVL in any given election year, and voters recruited to PEVL by One Arizona programs are 16.66 percentage points more likely to vote than before they were on PEVL. These effects are both large, and confirm the hypothesis that PEVL does increase the probability of voting, even when controlling for the motivation of an individual.
The self-select PEVL group has similar coefficients for all partisan groups, hovering close to the average result for all groups, slightly lower for Democrats than Republicans or Independents. However, the One Arizona programs have a larger effect on Democrats than other groups, and a slightly larger effect on independents than Republicans. This makes sense, given the nature of the programs and the targets. The effect for Republicans signed up through One Arizona programs is actually slightly lower than the effect for Republicans signed up to PEVL on their own, the only partisan group for which this is true. However, effects are still quite large for all groups.
Running the model separately on racial/ethnic groups shows that the self-selected PEVL treatment has a fairly similar effect on all groups, but the lowest effect on Latino voters. Conversely, the One Arizona PEVL treatment has a higher effect on Latino voters than every other group except Asian voters, which is likely unrepresentative due to the small sample size. It makes sense that One Arizona programs, which are mainly targeted to Latino voters, have the largest effect on Latino voters (when removing Asian voters as an outlier).
Both PEVL treatments are likely more effective in a Presidential years because they are magnified by many other layered “treatments,” such as much more saturation of media with election-related news and more expensive campaign communications by mail, phone, online media, and canvassing by candidates and other independent organizations. Interestingly, the effects of the two PEVL treatments are almost indistinguishable from one another in mid-term years, while they are several points apart in Presidential years, and the Presidential year effects are about twice as large as the mid-term year effects for both treatments.
These results, with the context given by the OLS results and analysis of means, shows that while self-selected PEVL voters are more likely to vote in any given general election, the effect of being on PEVL, while significant, is actually less for this group than for the One Arizona recruits. One Arizona recruits are less likely to vote in any given election that self motivated PEVL voters, but they increase their voting probability more through One Arizona programs than the self-motivated PEVL voters did when they got on PEVL.
One explanation for the higher effectiveness of the One Arizona programs as compared to the self-selected PEVL treatment is that the conversations at the door and connection to community organizations formed by the program are unique to the One Arizona programs. Clearly these connections are lasting and have an effect, and may be related to the “social pressure” effects found in other studies, showing that when voters are told that some entity is monitoring their voting behavior or cares about their participation, they are more likely to vote (Gerber, Green, and Larimer, 2008).
Overall, these results show that the One Arizona programs are highly effective in increasing the voting behavior of their targets, which have low likelihood to vote before being treated. These results confirm that the One Arizona programs are having the intended effect, and produce results in the form of changing voting habits and increasing participation in elections. It also confirms that being on PEVL alone increases voting behavior even in highly–motivated individuals, who show interest in voting by seeking out the PEVL on their own. When motivation is controlled for through the individual fixed effects, we can see that simply being on PEVL has a large effect on their voting behavior.
Works Cited
- American Community Survey (2013). US Census Bureau. Date file. Selected Social
- Characteristics in the United States. http://factfinder.census.gov/faces/tableservices/jsf/pages/productview.xhtml?pid=ACS_13_3YR_DP02&prodType=table
- Arizona Secretary of State (2015). Voter Registration and Historical Election Data. Retrieved from http://www.azsos.gov/elections/voter-registration-historical-election-data
- Fair Vote (2015). Voter Turnout. The Center for Voting and Democracy. http://www.fairvote.org/research-and-analysis/voter-turnout/
- Franklin (2001). The Dynamics of Electoral Participation. In Leduc, Niemi & Norris (Eds.), Comparing Democracies 2: Elections and Voting in Global Perspective (Chp 10). Thousand Oaks CA: Sage.
- Gerber, Green, & Larimer (2008). Social Pressure and Voter Turnout: Evidence from a Large-Scale Field Experiment. American Political Science Review Vol. 102, No. 1 pg 33. http://jwolf-ra.wdfiles.com/local--files/field-experiments/SocialPressure%20-%20Gerber_Green_Larimer_2008.pdf
- Harmon, Posner, Jawando, & Dhaiti (2015). Health of State Democracies. Center for American Progress Action Fund. http://www.healthofstatedemocracies.org/factors/noqabsentee.html
- Heredia, Francisco (June 2015). Executive Director of One Arizona. Personal Interview.
- Highton (1997). Easy Registration and Voter Turnout. The Journal of Politics, Vol. 59, No. 2. pp. 565-575. http://links.jstor.org/sici?sici=0022-3816%28199705%2959%3A2%3C565%3AERAVT%3E2.0.CO%3B2-%23
- Knack and James (2000). Election Date Registration and Turnout Inequality. World Bank, Munich Personal RePEC Archive. https://mpra.ub.uni-muenchen.de/27244/1/MPRA_paper_27244.pdf
- Kousser & Mullin (2007). Does Voting by Mail Increase Participation? Using Matching to Analyze a Natural Experiment. Political Analysis 15, 428–445. http://citeseerx.ist.psu.edu/viewdoc/download?doi=10.1.1.463.6627&rep=rep1&type=pdf
- National Conference of State Legislatures (2015). Same Day Voter Registration. http://www.ncsl.org/research/elections-and-campaigns/same-day-registration.aspx
- One Arizona (2014). State of the Latino Electorate. Retrieved from: http://www.onearizona.org/2014_state_of_latino_electorate
- Rosenberg and Chen (2009). Expanding Democracy: Voter Registration Around the World. Brennan Center for Justice, New York University School of Law. http://www.brennancenter.org/sites/default/files/legacy/publications/Expanding.Democracy.pdf
- Southwell & Burchett (2000). The Effect of All-Mail Elections on Voter Turnout. American Politics Research. Vol. 28, 72. http://jwolf-ra.wdfiles.com/local--files/field-experiments/SocialPressure%20-%20Gerber_Green_Larimer_2008.pdf
- United States Elections Project (2015). Data file. State Turnout Rates, 1980-2012. Retrieved from https://docs.google.com/spreadsheets/d/1or-N33CpOZYQ1UfZo0h8yGPSyz0Db-xjmZOXg3VJi-Q/edit?usp=sharing
- Voter Activation Network (2015). Data file. Accessed by Arizona Wins through subscription to America Votes VAN, 2015.
- Wolfinger & Rosenstone (1980). "Who Votes?" New Haven: Yale University Press.
- Purcell, Helen. Permanent Early Voting List Information. Maricopa County Recorder’s Office. Retrieved from: https://recorder.maricopa.gov/earlyvotingballot/permanentevlistinfo.aspx